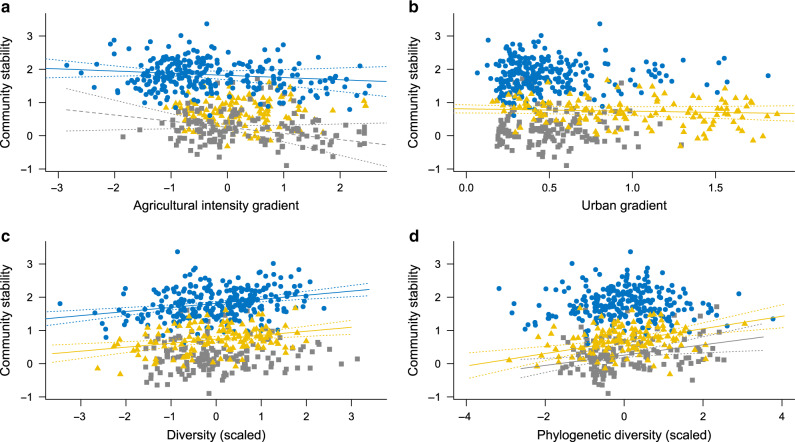
Fig. 3. Regressions between community stability and landscape gradient or community diversity.
Panels refer to agricultural intensity gradient (a), urban gradient (b), species diversity (c), and phylogenetic diversity (d). Bats, birds, and butterflies are in gray squares, blues circles, and yellow triangles, respectively. Solid and dashed lines represent model predictions for significant and marginally significant (p value = 0.06) relationships, respectively. Dotted lines represent the CI 95% of model predictions. For bats estimate = −0.08, p value = 0.06 and estimate = 0.11, p value = 4 × 10⁻³ for (a) and (d), respectively. For birds estimate = −0.10, p value = 3 × 10⁻³ and estimate = 0.12, p value = 8 × 10⁻⁶ for (a) and (c), respectively. For butterflies estimate = −0.17, p value = 0.01, estimate = 0.12, p value = 5 × 10⁻⁴, and estimate = 0.08, p value = 0.02 for (b–d), respectively. Linear mixed-effects models are used for bats, and linear models for birds and butterflies. Diversity and phylogenetic diversity values are scaled so that all three taxa can be represented in the same plot.

