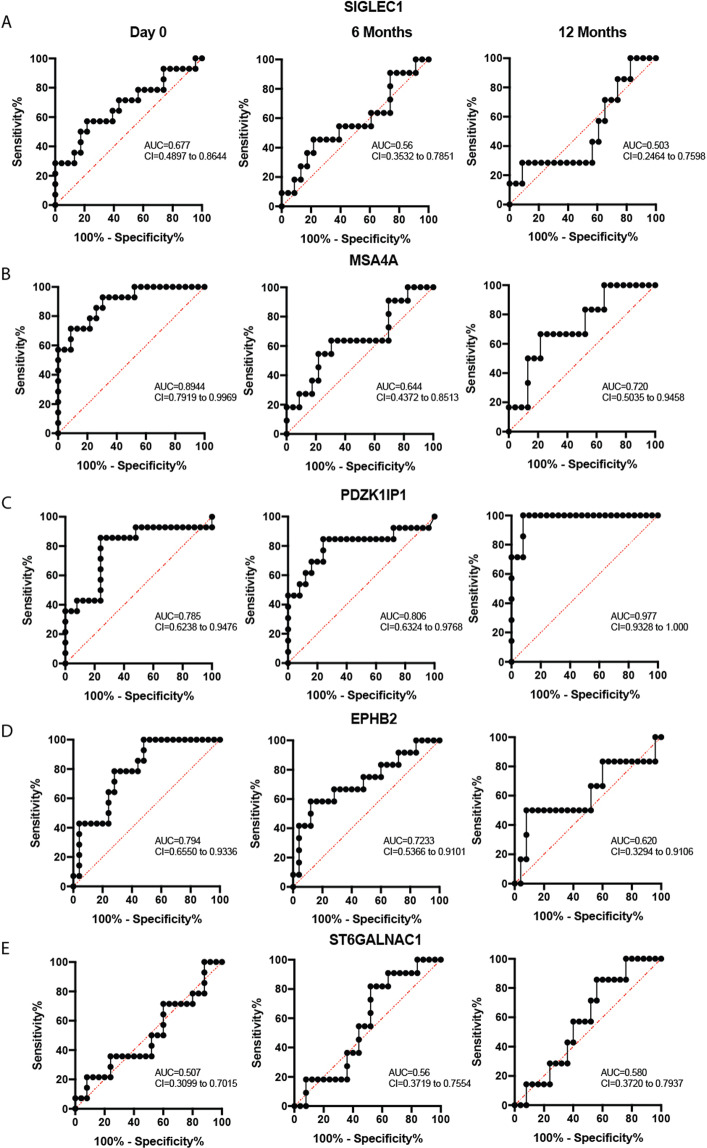
Figure 4.
Receiver operating characteristics showing the average predictive performance for Rheumatoid Arthritis. The specificity and sensitivity rate for 5 genes showing the Area Under the Curve (AUC) for patients presenting to the clinic with a diagnosis of RA at Day 0, 6 Months and 12 months follow-up, when compared to healthy individuals. Receiver operating characteristic curves of (A) SIGLEC1, (B) MSA4A, (C) PDZK1IP1, (D) EPHB2 and (E) ST6GALNAC1 are presented.

