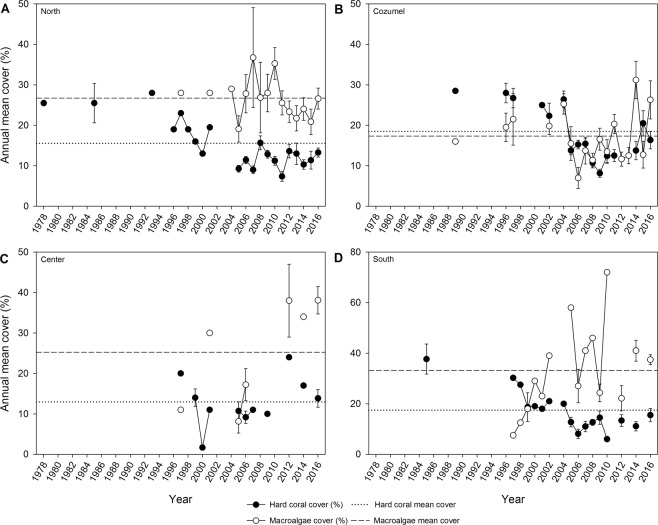
Figure 4.
Regional annual means of hard coral and macroalgae cover (%) from 1978 to 2016. (A) The Northern region, (B) Cozumel, (C) Center, and (D) Southern region. Circles represent hard coral cover (black), and macroalgae cover (white) as means ± S.E. (unless n < 3). Circles connected by the line represent subsequent years. The dotted and dashed lines represent the average hard coral cover and macroalgae, respectively, in the studied time.

