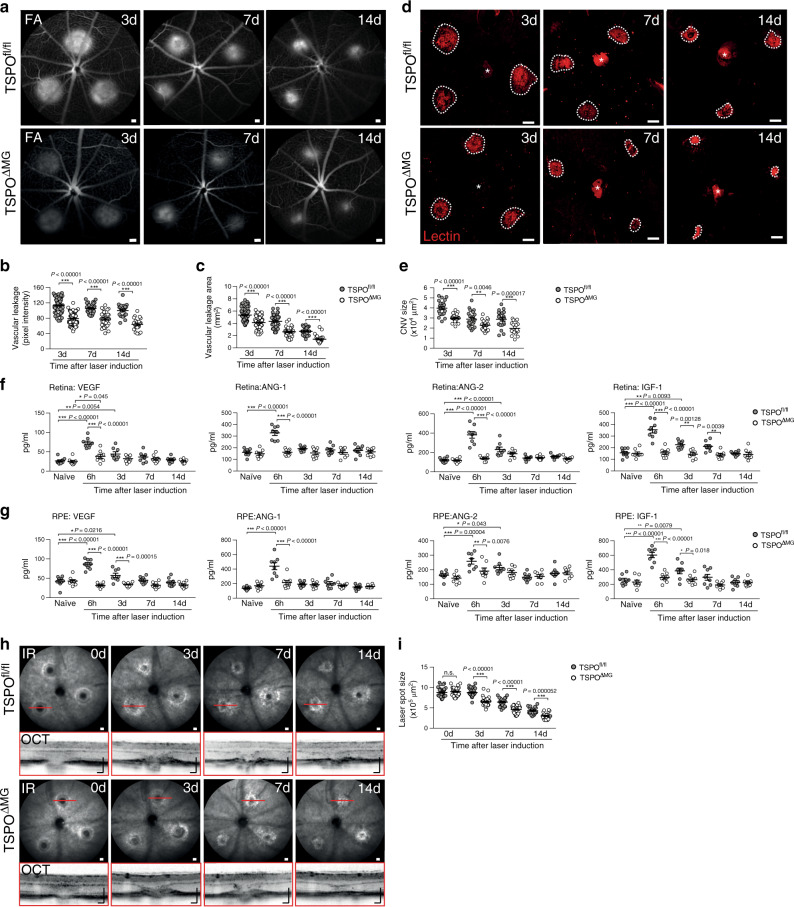
Fig. 4. TSPO deficiency inhibits laser-induced vascular leakage and pathological CNV in mice.
a Representative late phase fundus fluorescein angiography (FFA) images at indicated time points post laser injury. Scale bar: 200 µm. b Quantification of vascular leakage intensity after laser-induced CNV. 3 d n = 85; 7 d n = 36; and 14 d n = 22 retinas from individual mice. FA fluorescein angiography. c Quantification of vascular leakage area after laser-induced CNV. DMSO/XBD173 3 d n = 91/79; 7 d n = 42/33; 14 d n = 30 retinas from individual mice. d Representative laser-induced CNV stained with isolectin B4 in RPE/choroidal flat mounts. Scale bar: 100 µm; e Quantification of laser-induced CNV area in RPE/choroidal flat mounts. n = 22 RPE/choroids from individual mice. f Pro-angiogenic growth factor levels in retinas of naïve and lasered TSPOfl/fl and TSPOΔMG mice at indicated time points. n = 8 retinas/RPEs from individual mice. g Pro-angiogenic growth factor levels in RPE/choroids of naïve and lasered TSPOfl/fl and TSPOΔMG mice at indicated time points. n = 8 retinas/RPEs from individual mice. h Representative infrared (IR) fundus images at indicated time points post laser injury. Lower panel shows OCT scan from one laser spot marked by a red line. Scale bar: 200 µm. i Quantification of laser spot size. 0 d n = 45, 3 d n = 39, 7 d n = 33, and 14 d n = 25 eyes from individual mice. Data show mean ± SEM and a linear mixed model was used for statistical analyses; *P < 0.05; **P < 0.01; and ***P ≤ 0.001. n.s., not significant. Source data are provided as a Source Data file.

