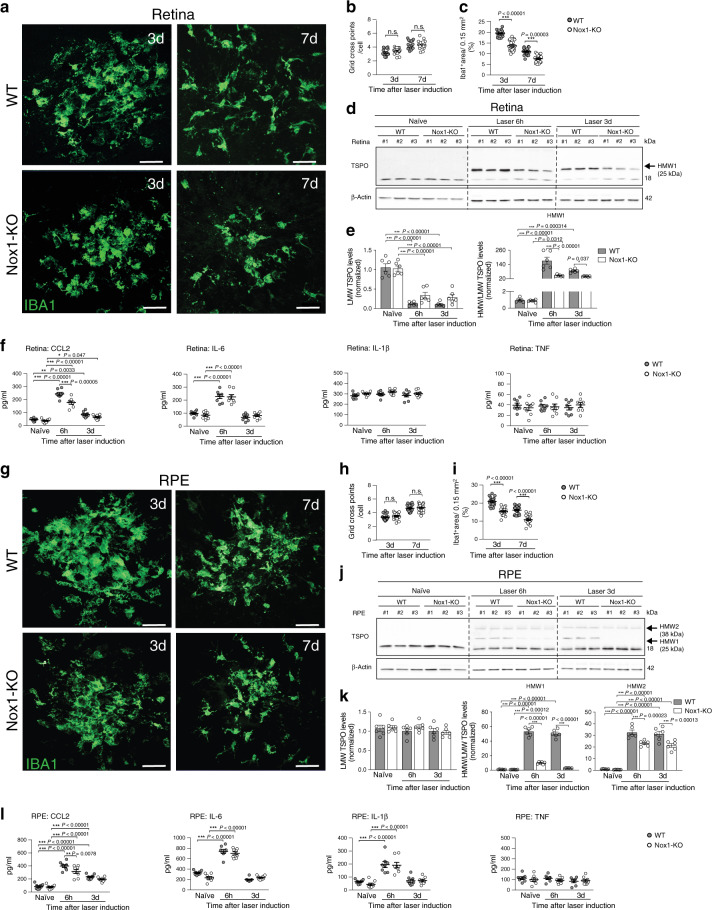
Fig. 7. NOX1 deficiency reduces mononuclear phagocyte reactivity in laser-induced CNV in mice.
a Representative images show accumulation of Iba1+ cells within the laser lesion in retinal flat mounts. Scale bar: 50 μm. b Quantification of Iba1+ cell morphology within laser lesions. 3 d n = 18; 7 d n = 22 spots. c Quantification of Iba1+ area of the laser lesions. 3 d n = 18; 7 d n = 22 spots. d TSPO protein levels in retinal cell extracts of naïve and lasered WT and Nox1-KO mice at indicated time points. Each lane represents an individual retina. Dotted line indicates individual blots, which were processed in parallel. e Densitometric analysis of western blots. LMW TSPO signals were normalized to β-Actin and HMW:LMW TSPO ratio determined. n = 6 retinas from two independent experiments. f Cytokine levels in retinas of naïve and lasered WT and Nox1-KO mice at indicated time points. n = 8 retinas from individual mice. g Representative images of Iba1+ cells within the laser lesion in RPE/choroidal flat mounts. Scale bar: 50 μm. h Quantification of Iba1+ cell morphology within laser lesions. 3 d n = 18, 7 d n = 22 spots. i Quantification of Iba1+ area of the laser lesions. 3 d n = 18, 7 d n = 22 spots. j Western blots showing TSPO expression in RPE/choroidal cell extracts of naïve and lasered WT and Nox1-KO mice at indicated time points. k Densitometric analysis of western blots. n = 6 RPE/choroids from two independent experiments. LMW lower molecular weight; HMW higher molecular weight. l Pro-inflammatory cytokine levels in RPE/choroids of naïve and lasered WT and Nox1-KO mice. n = 8 RPE/choroids from individual mice. Data show mean ± SEM. A linear mixed model was used for statistical analyses, *P < 0.05; **P < 0.01; and ***P ≤ 0.001. Source data are provided as a Source Data file.

