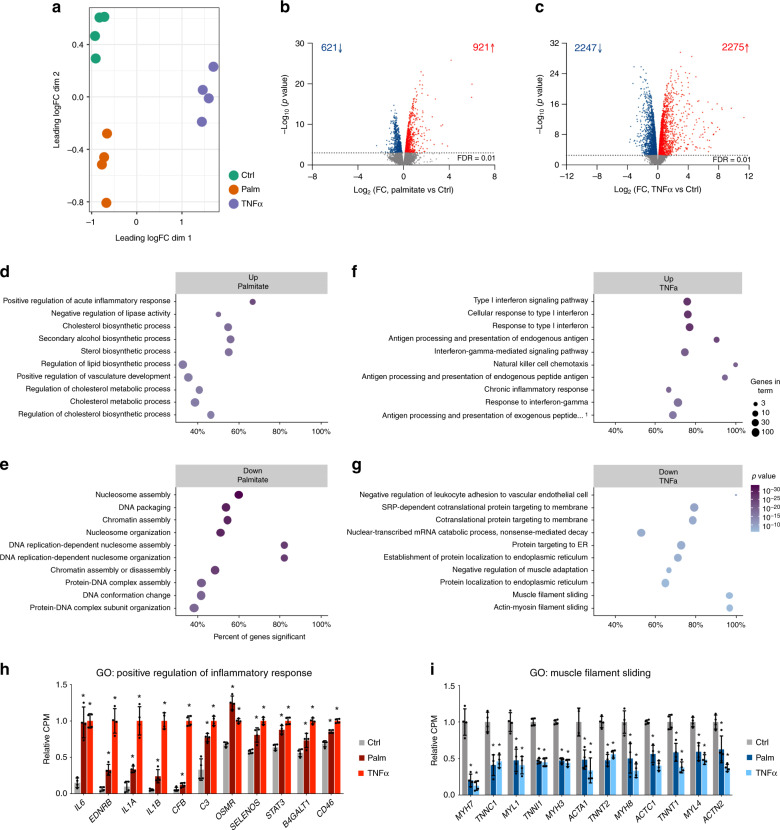
Fig. 1. Gene expression analysis after palmitate or TNFα treatment.
a MDS plot of RNA-seq data from control (ctrl), palmitate (palm) or TNFα treated human skeletal myotubes. Leading log fold-change (logFC) is the mean logFC between the 500 most divergent genes between each pair of samples. On the axes, “dim” means dimension. b, c Volcano plot representation of genes regulated by palmitate (b) or TNFα (c). Blue dots represent genes that are significantly downregulated and red dots represent genes that are upregulated by the respective treatments (n = 4 biological replicates, FDR < 0.01). d, e Top 10 GO terms upregulated (d) or downregulated (e) by palmitate. f, g Top 10 GO terms upregulated (f) or downregulated (g) by TNFα. The x-axis shows the percent of genes in the category that are differentially expressed with an FDR < 0.01. The legend shows ‘Genes in term’, which is the number of genes expressed in these samples. The P-value is calculated using the CAMERA method. All terms have an FDR of less than 0.0001. h Examples of palmitate and TNFα upregulated genes related to acute inflammatory response. Relative CPM indicates RNA-seq counts per million relative to TNFα treatment. Values are represented as the mean ± S.D. (n = 4 biological replicates, *FDR < 0.01). i Examples of palmitate and TNFα downregulated genes related to muscle filament sliding. Relative CPM indicates RNA-seq counts per million relative to control. Values are represented as the mean ± S.D. (n = 4 biological replicates). Asterisks indicate genes that are significantly regulated in the RNA-seq analysis (*FDR < 0.01).

