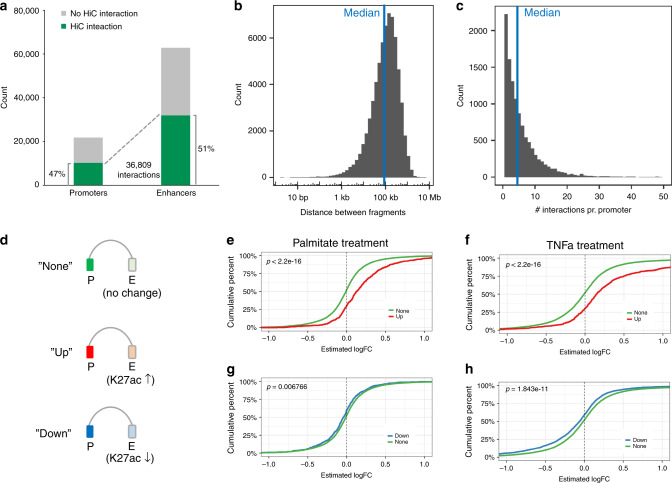
Fig. 3. Promoter capture Hi-C identifies interactions between promoters and enhancers.
a Overview of all the significant interactions between baited promoters and H3K4me1/H3K27ac positive enhancers. b Histogram showing the distance between interacting promoter-fragments and enhancer-fragments. The median distance is 93.8 kb. c Histogram showing the number of enhancer interactions pr. promoter. The median number of interactions is 4. d Promoters captured by the Promoter Capture Hi-C were divided into three groups; promoters connected to enhancers that did not change H3K27ac in response to palmitate or TNFα treatment (“None”), and promoters connected to enhancers that either gained H3K27ac (“Up”) or lost H3K27ac (“Down”). e–j Empirical cumulative distribution function (EDCF) plots of gene expression changes (RNA-seq logFC values) in the “Up” versus the “None” group for palmitate (e) or TNFα treatment (f), and the “Down” versus the “None” group for palmitate (g) or TNFα treatment (h). X-axis is the RNA-seq logFC, y-axis is the fraction of genes with this logFC or less. Differences between empirical cumulative distribution functions were tested using a Kolmogorov-Smirnov test (KS-test).

