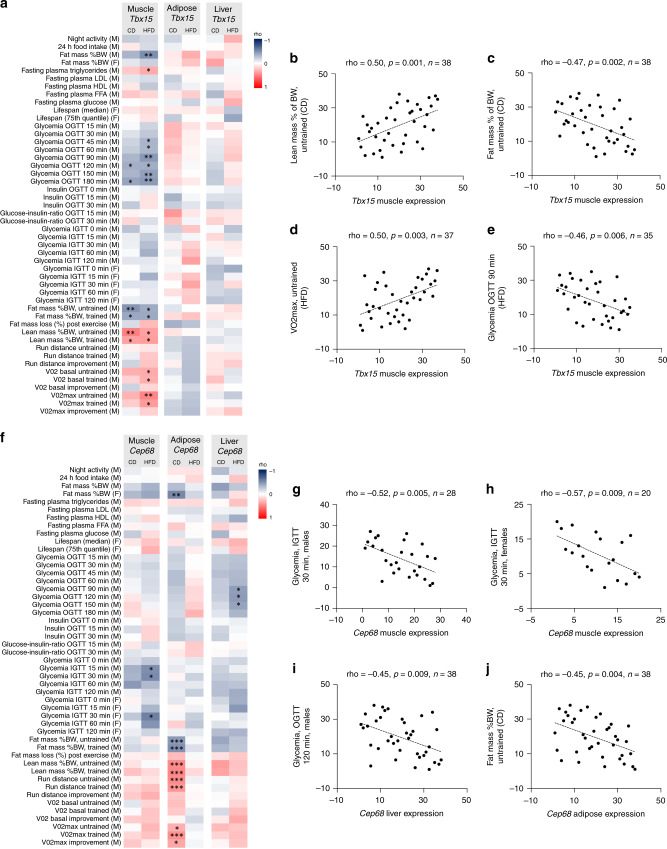
Fig. 5. Correlating GWAS SNP-target genes with metabolic phenotypes in BXD mice strains.
a Heatmap representation of rho-values from correlations between 48 metabolic measurements in CD or HFD fed mice and Tbx15 expression in skeletal muscle, adipose or liver tissue. The p-values from the 48 correlations from each diet and tissue were adjusted using false discovery rate correction (FDR) (*FDR < 0.2, **FDR < 0.1, ***FDR < 0.05). b–e Skeletal muscle expression of Tbx15 is positively correlated with lean mass (% of body weight) (b), negatively correlated with fat mass (% of body weight) (c) positively correlated with VO2max (d) and negatively correlated with glycemia during an oral GTT (OGTT) (e). Statistics was performed using Spearmans rank correlation analysis. f Heatmap representation of rho-values from correlations between 48 metabolic measures in CD or HFD fed mice and Cep68 expression in skeletal muscle, adipose or liver tissue (*FDR < 0.2, **FDR < 0.1, ***FDR < 0.05). g–j Cep68 is negatively correlated with glycemia during an intraperitoneal GTT (IGTT) in both male (g) and female (h) mice in skeletal muscle, as well as an oral GTT (OGTT) in liver (i) and fat mass (% of body weight) in adipose tissue (j). Statistics was performed using Spearmans rank correlation analysis.

