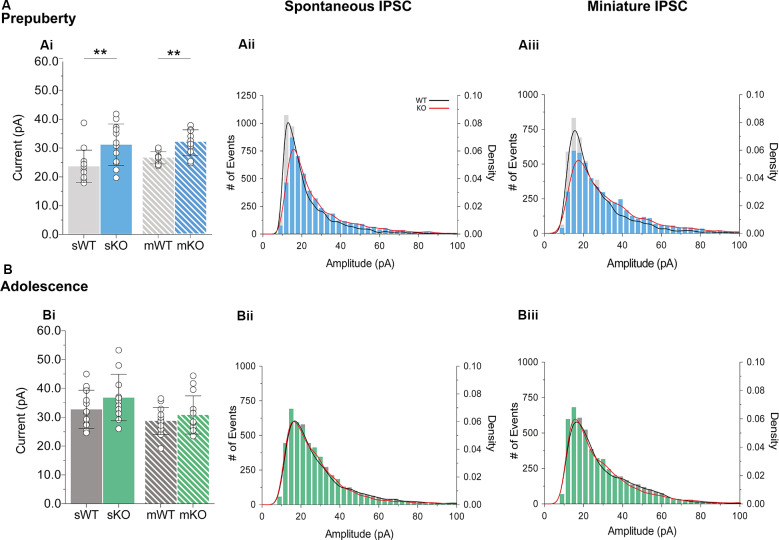
Figure 4.
IPSC amplitude potentiation in prepubescent Fmr1-KO mPFC. (A) Prepubescent IPSC amplitudes were found potentiated regardless of Na+ channel blockade [Ai, sIPSC (WT(n = 12) = 23.64 ± 5.62 pA, KO(n = 12) = 31.18 ± 7.17 pA, p < 0.01), mIPSC (WT(n = 9) = 26.65 ± 2.12 pA, KO(n = 10) = 31.83 ± 4.50 pA, p < 0.01)]. (B) During adolescence sIPSC [Bi, (WT(n = 14) = 32.75 ± 6.64 pA, KO(n = 11) = 36.82 ± 8.05 pA, p = 0.18)] and mIPSC [Bi, (WT(n = 13) = 28.72 ± 4.72 pA, KO(n = 14) = 30.79 ± 6.64 pA, p = 0.36)] amplitudes were equal between genotypes. Histograms of amplitude distributions for sIPSC (Aii, Bii) and mIPSC (Aiii,Biii) revealed a drop at small amplitudes along with a shift toward larger amplitude bins during pre-puberty (Aii,Aiii), whereas no observable shift in amplitude distributions was observed during adolescence (Bii,Biiii). Solid lines represent WT (black) and Fmr1-KO (red) probability density plots of the underlying amplitude distributions. Genotypic differences were assessed with the Student’s t-test. For all panels asterisks denote statistical significances of **p < 0.01. Error bars represent SD.

