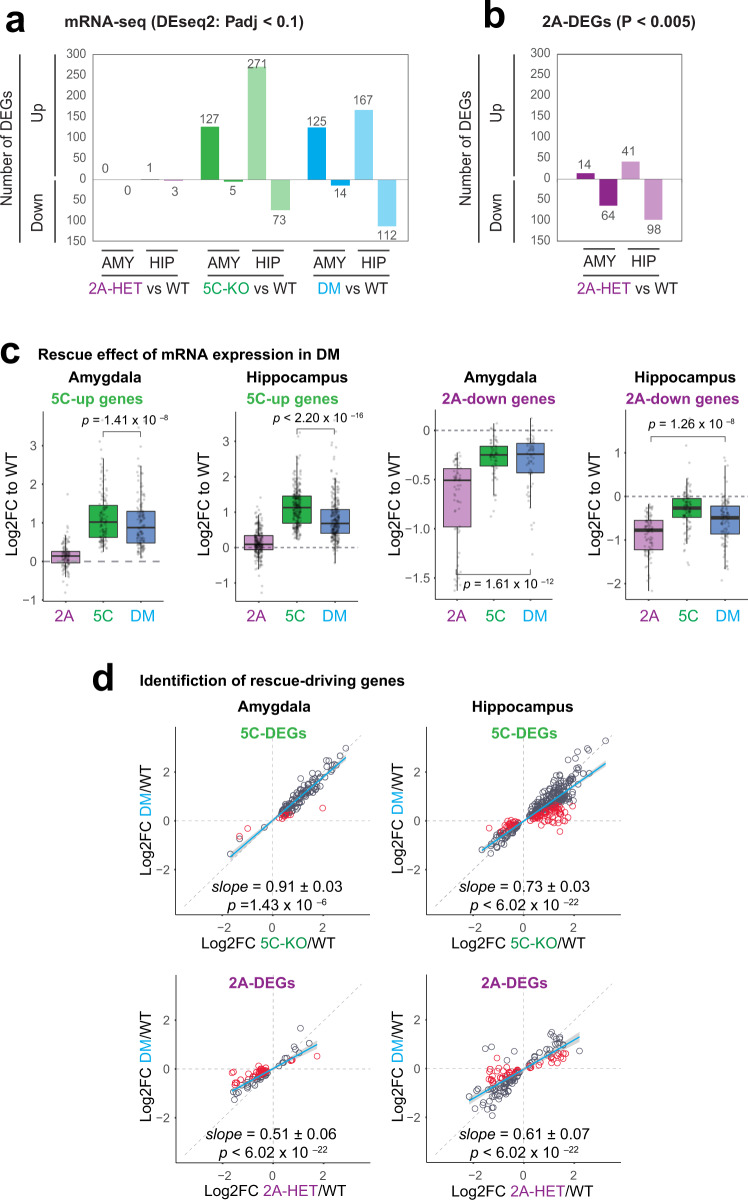
Fig. 5. The transcriptomes in the amygdala and hippocampus.
a Number of differentially expressed (DE) genes across genotypes were determined using a threshold of p-adj < 0.1. or relaxed cut-off of p < 0.005 for Kmt2a-HET in b (see also Table S1). We analyzed amygdala and hippocampal tissues from four animals for each genotype. c Behavior of single-mutant DEGs in DM. Log2 fold change of DEGs relative to WT were plotted across the three mutants. Boxplot features: box: interquartile range (IQR), bold line: median, gray dots: individual genes. Associated p values result from Wilcoxon signed-rank tests. d Identification of rescue-driving genes and regression analysis. Blue fitting lines and slopes result from linear regression of log2 fold changes between the two genotypes. Gray shade: 95% confidence interval. P-values indicate probability of the null hypothesis that the fitting line does not differ from 1 (Warton et al.48). Red circles: rescue-driving genes (see Methods).

