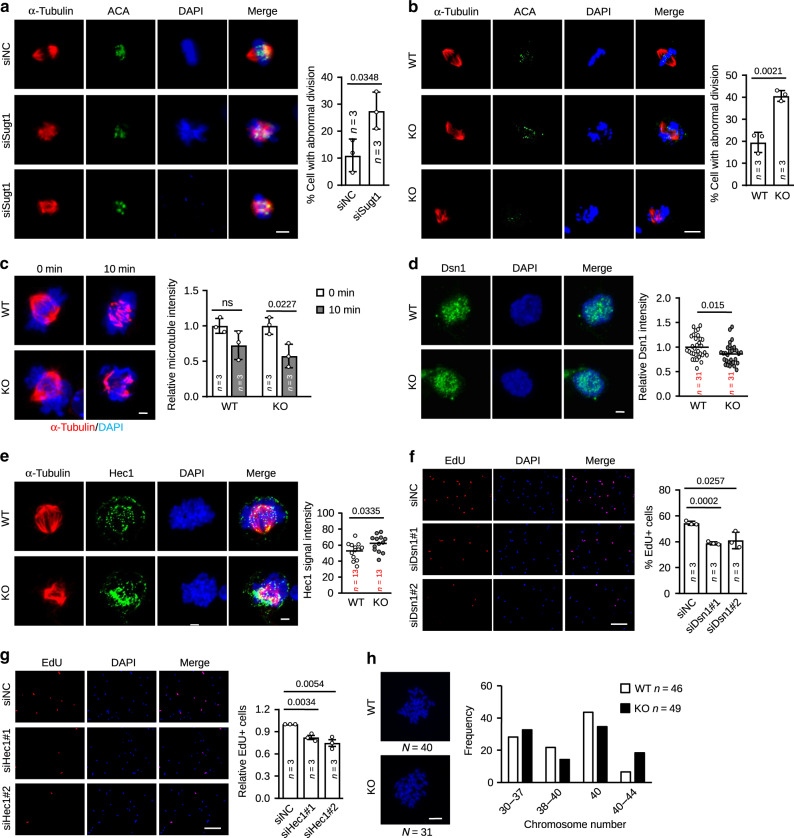
Fig. 6. SAM/Sugt1 regulates kinetochore assembly and mitotic division in myoblasts.
a IF staining for α-Tubulin and ACA in ASC transfected with siSugt1 or negative control oligos. Cells in metaphase with mis localized ACA and non-bipolarized distribution of α-Tubulin were regarded as abnormally dividing cells and their percentage was quantified from at least 40 cells per group for each experiment. n = the number of independent experiments. b The above assay was performed in WT and KO ASC and the quantification of abnormally dividing cells was conducted from at least 20 cells per group for each experiment. n = the number of independent experiments. c The above SCs were cold treated on ice for the indicated time and stained for α-Tubulin. The average intensity of staining was measured from at least 6 cells per group for each experiment using in house script. n = the number of independent experiments. d IF staining of Dsn1 or e Hec-1 and Tubulin were performed in cultured SCs from WT or KO mice. Cells were synchronized to the mitotic stage by nocodazole treatment for 3 h in d. Maximum Dsn1 and Hec1 fluorescent signals at kinetochores were quantified from the indicated number of cells. f EdU-labeling assay in ASCs transfected with siDsn1 or g siHec1. The percentage of EdU+ SCs was quantified. h (Left) Representative images of DAPI-stained chromosome metaphase spreads from WT and KO SCs. (Right) Quantification of chromosome numbers of metaphase spreads from WT and KO SCs. The data are presented as mean ± SD in a–c, f, and g. The center line in d and e is presented as mean. The p values by two-tailed unpaired t test are indicated in a–g, ns not significant. The total number of independent experiments in a–c, f, g and biologically independent samples in d, e, and h are indicated. Scale bars: 5 µm a and b, 2 µm c–e, 100 µm f and g, 50 µm h. Source data are provided as a Source Data file.

