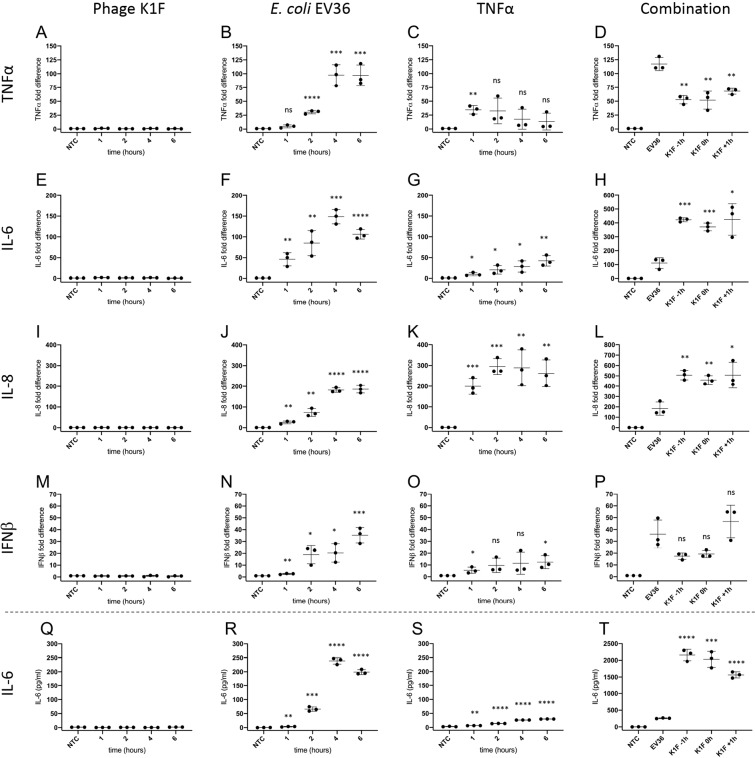
Figure 7.
Expression pattern of inflammatory markers by real-time qPCR (A–P). hCMEC cultures were incubated with 107 CFU/ml E. coli EV36, 107 PFU/ml phage K1F or 500 pg/ml TNFα and specific mRNA levels measured over time, or incubated with 107 CFU/ml E. coli EV36 having 104 PFU/ml phage K1F added 1 h before-, simultaneously-, or 1 h after bacterial addition, and incubated for 6 h before RNA harvest. Real-time qPCR was performed with primer pairs specific for TNFα (A–D), IL-6 (E–H), IL-8 (I–L) and IFNβ (M–P). Data were expressed relative to internal control (GAPDH) and then normalised to the untreated control value. Expression of IL-6 protein as measured by ELISA (Q-T). hCMEC cultures were incubated with 107 PFU/ml phage K1F, 107 CFU/ml E. coli EV36 or 500 pg/ml TNFα, or incubated with 107 CFU/ml E. coli EV36 having 104 PFU/ml phage K1F added 1 h before-, simultaneously-, or 1 h after bacterial addition, and incubated for 6 h. NTC = Untreated cultures. +/− SD, n = 3 in each case. Probability values (p-values) are displayed as p ≤ 0.05 (*), p ≤ 0.01 (**), p ≤ 0.001 (***), p ≤ 0.0001 (****) and not statistically significant p ≥ 0.05 (ns). P-values are relative to NTC for single treatments experiments and relative to E. coli EV36 for combination treatment experiments.

