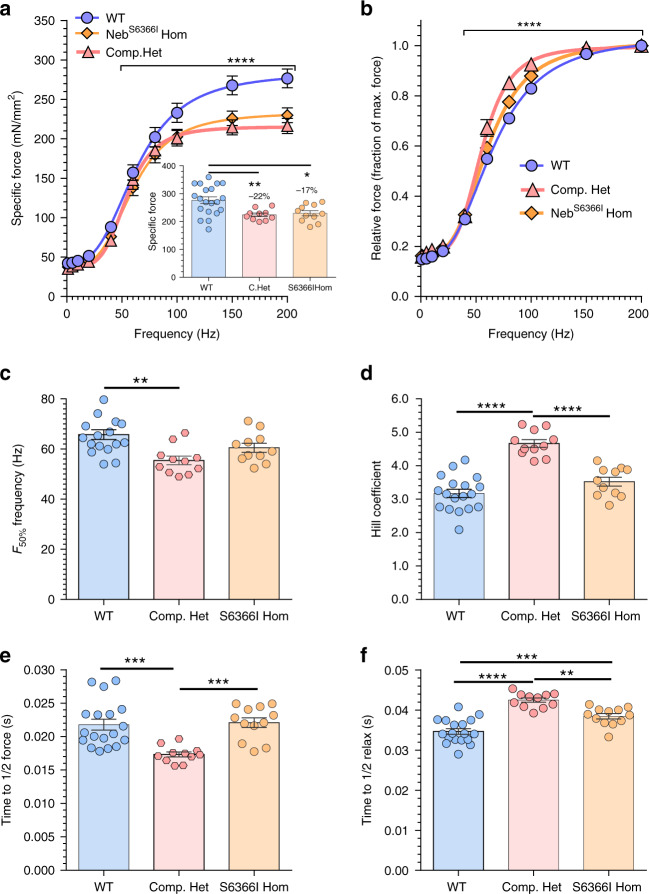
Fig. 6. Muscle mechanics.
a Force-frequency relation of WT, Compound-Het and S6366I Hom EDL muscle. Inset shows maximal force (200 Hz stimulation rate). Force is reduced in Compound-Het and S6366I Hom mice. (Force expressed as specific force: force per unit area of muscle, mN/mm2). *p = 0.013, **p = 0.007. b Relative force-frequency shows steeper force rise in Compound-Het mice. c Frequency for 50% force (F50%) is reduced in Compound-Het mice. **p = 0.0012. d Hill coefficient is increased in Compound-Het mice. ****p < 0.0001. e Time to 1/2 maximal force of 200 Hz tetanus is reduced in Compound-Het mice. ***p = 0.0005. f Time to 1/2 relaxation of 200 Hz tetanus is increased in Compound-Het mice and S6366I Hom mice. **p = 0.002, ***p = 0.0008 and ****p < 0.0001. a–f: n(WT) = 20 mice; n(Compound-Het) = 11 mice; n(S6366I Hom) = 11 mice. Bar values are mean ± SEM. a, b Non-linear least squares fit to Hill curve with as null hypothesis that one curve fits all data sets. Test (Sum-of-squares F-test) reveals that the null hypothesis is rejected in each panel (p ≤ 0.0001, F (DFn, DFd) 9.633 (8,408)). a inset and c–f: ordinary one-way ANOVA without matching or paring. A posthoc multiple testing comparison with multiple testing correction (Tukey) was performed. Source data are provided as a Source Data file.

