Figure 2.
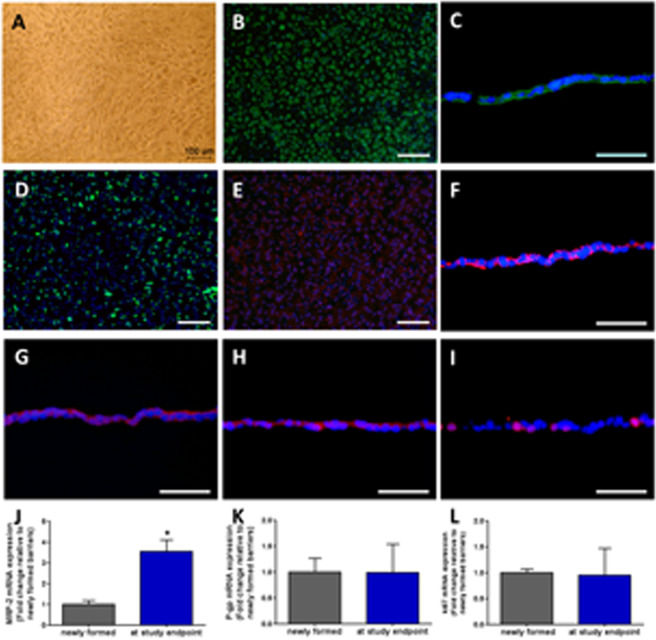
Characterization of proximal tubule barriers. (A) The formation of a proximal tubule monolayer on a permeable support insert. (B) CK8/18 (green) (C) CK8/18 (green), cross section (D) ace-tubulin (green) (E) MRP-2 (red) (F) Na + -K + -ATPase (red) (G) ZO-1 (red) (H) Claudin-10 (red) (I) Ki67 (red). Nuclei were stained with DAPI (blue). Scale bars B, D, and E: 100 μm; C, F, G, H and I: 50 μm. qRT-PCR analysis of (J) MRP-2 (K) P-gp (L) Ki67 gene expression. The fold changes in mRNA expression of the barriers at the endpoint are represented relative to barriers newly formed; data are the mean ± SEM, experiments were performed in triplicates.

