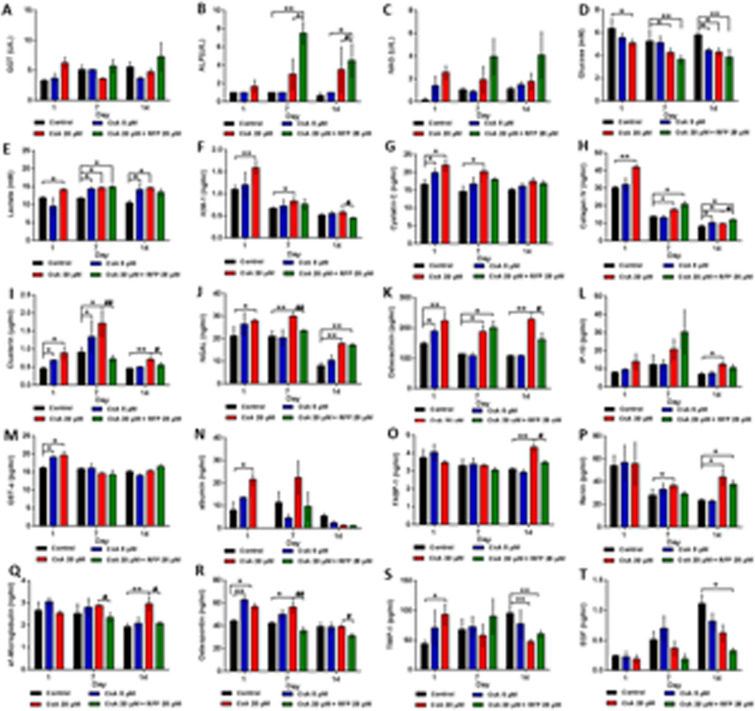
Figure 7.
Protein expression of noninvasive toxicity biomarkers in the excretory lumen after daily administration of CsA alone or with concomitant use of RFP in liver-proximal tubule coculture chips for 14 days. Protein levels of (A) GGT (B) ALP (C) NAG (D) Glucose (E) Lactate (F) KIM-1 (G) Cystatin C (H) Collagen IV (I) Clusterin (J) NGAL (K) Osteoactivin (L) IP-10 (M) GST-α (N) albumin (O) FABP-1 (P) Renin (Q) α1-microglobulin (R) Osteopontin (S) TIMP-1 (T) EGF in excretory media on days 1, 7 and 14. Data are the mean ± SEM, experiments were performed in triplicates (control and low-dose groups) or quadruplicate (high-dose and coadministration groups). * (#) or ** (##) indicates significant difference p < 0.05 or p < 0.01, respectively. * or # indicates differences compared with the corresponding controls or when the coadministration group was compared with the high-dose group, respectively.

