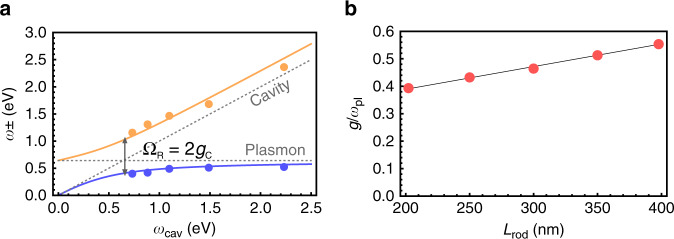
Fig. 4. Analysis of the experimental data.
a Fitting of the measured polaritonic dispersion of the coupled plasmon–cavity system (Lrod = 300 nm) with Hopfield Hamiltonian transition energies. Dots show resonant energies of the coupled system extracted as experimental reflection dips, lines are Hopfield polaritons dispersion, gray dashed lines are the bare cavity and bare plasmon energies. ΩR denotes Rabi splitting between the two polaritonic modes at the zero-detuning point. b Normalized coupling strength gC/ωpl at zero detuning versus nanorod length. Solid line is the linear interpolation.

