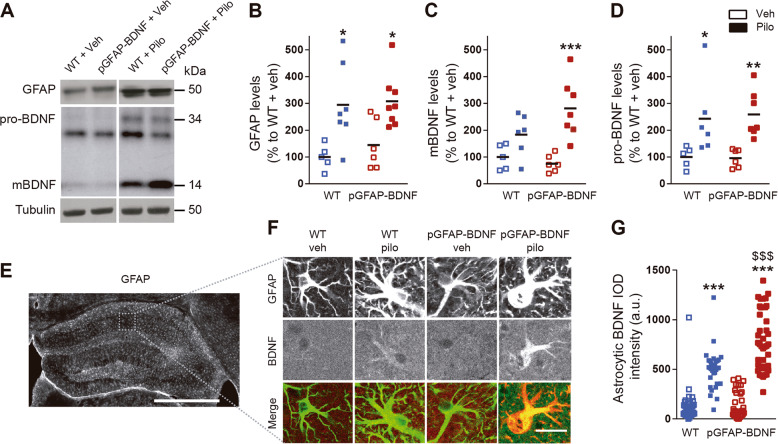
Fig. 2. Astrocytic BDNF levels in the hippocampus of the pilocarpine-treated WT and pGFAP-BDNF mice.
a Immunoblotting analysis of GFAP, BDNF, and tubulin as a loading control in WT and pGFAP-BDNF mice treated with vehicle or pilocarpine. b Densitometry quantification of GFAP results as in a. Statistical analysis revealed a significant increase on GFAP protein levels in groups of mice treated with pilocarpine (two-way ANOVA, variable treatment: F(1,22) = 17.44, p < 0.001). c Densitometry quantification of the mature form of BDNF (mBDNF) results as in a. Statistical analysis revealed a significant increase on mBDNF protein levels (two-way ANOVA variable treatment: F(1,26) = 16.89, p < 0.001) specifically in pGFAP-BDNF mice treated with pilocarpine (post hoc test: p < 0.001). d Densitometry quantification of pro-BDNF results as in a. Statistical analysis revealed a significant increase on pro-BDNF protein levels (two-way ANOVA variable treatment: F(1,20) = 17.50, p < 0.001) in both WT and pGFAP-BDNF mice treated with pilocarpine. e Representative image showing GFAP immunofluorescence in the hippocampus. Scale bar, 500 μm. f Representative immunofluorescence images showing GFAP and BDNF immunoreactivity in the hippocampus of WT and pGFAP-BDNF mice treated with vehicle or pilocarpine. Scale bar, 20 µm. g Quantification of astrocytic BDNF immunoreactivity. Statistical analysis revealed a significant increase in the astrocytic BNDF (two-way ANOVA interaction: F(1,149) = 16.37, p < 0.0001; variable treatment: F(1,149) = 235.8, p < 0.0001; variable genotype: F(1,149) = 20.55, p < 0.0001). Data were analyzed by two-way ANOVA followed by Bonferroni’s test. *p < 0.05, **p < 0.01, ***p < 0.001 compared to Veh. $$$p < 0.001 compared to WT-Pilo. All mice were used at 10 weeks of age and were males.

