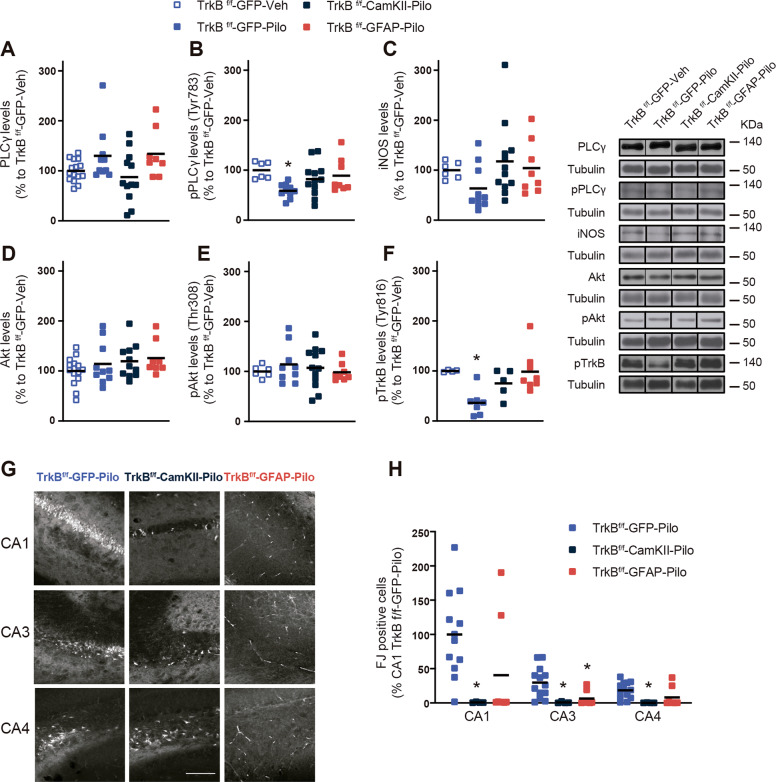
Fig. 7. Pilocarpine-induced biochemical effects in the hippocampus of mice with genetic deletion of TrkB in neurons or in astrocytes.
Protein levels of the principal TrkB downstream signaling proteins including a PLCγ, b pPLCγ, c Akt, and d pAkt and iNOS Histograms represent the protein expression expressed as the percentage of TrkBf/f-GFP-Veh. Representative immunoblots are shown. All data are shown as the mean ± SEM (TrkBf/f-GFP-Veh (n = 15); TrkBf/f-GFP-Pilo (n = 10); TrkBf/f-GFAP-Cre-Pilo (n = 8); TrkBf/f-CaMKII-Cre-Pilo (n = 12)). Data were analyzed by one-way ANOVA followed by Tukey’s test. *p < 0.05 compared with TrkBf/f-GFP-veh. g Representative images showing Fluoro-Jade-positive cells (FJ+) in the three experimental conditions in CA1, CA3, and CA4. Scale bar: 100 μm. The histogram represents the number of FJ+ cells expressed as the percentage of the number of positive cells found in the CA1 of TrkBf/f-GFP-Pilo. All data are shown as mean ± SEM (TrkBf/f-GFP-Pilo (n = 13); TrkBf/f-CaMKII-Cre-Pilo (n = 4); TrkBf/f-GFAP-Cre-Pilo (n = 8)). Data were analyzed by one-way ANOVA followed by Tukey’s test. *p < 0.05 compared with TrkBf/f-GFP-Pilo.

