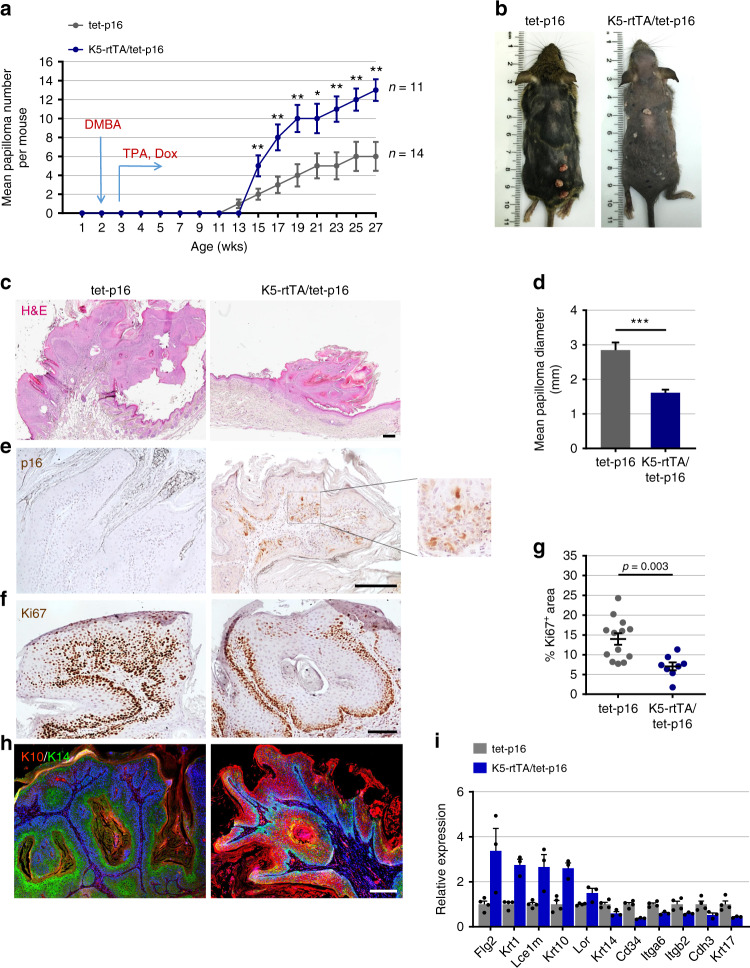
Fig. 3. p16 promotes carcinogen-induced papilloma formation but slows lesion growth.
a Average number of papillomas per mouse formed over time (age in weeks) in K5-rtTA/tet-p16 and sibling control tet-p16 mice treated once with DMBA at 3 weeks, followed by continued TPA treatment and p16 activation by dox starting at 4 weeks. n = 14, 11 mice per group combined from four independent experiments. b Images of indicated mice at 27 weeks of age, showing papillomas formed on back skins. c H&E staining of papillomas from control and p16-induced mice. d Mean diameter of papillomas from the same mice at 27 weeks. n = 84, 136 papillomas per group. e Immunostaining for p16 (brown) in papillomas from same mice. Enlarged inset is shown on right. f Staining for Ki67 (brown) in papillomas from same mice. g Percentage of Ki67-stained area of the epithelial component of papillomas (dots) from indicated mice, scored by image analysis. n = 13,8 in respective groups. h Papillomas from control and p16-induced mice stained for K14 (green) and K10 (red), marking the basal and suprabasal layers, respectively. i Relative mRNA levels of epidermal differentiation-associated genes in whole papillomas from control and p16-expressing mice, measured by mRNA-seq. n = 4, 3. P < 0.05 for all genes. Graphs indicate mean values across mice (a) or across lesions (d, g, i) ± S.E.M. *P < 0.01, **P < 0.001, ***P < 0.0001, t test. Scale bars—200 μm, except f—100 μm.

