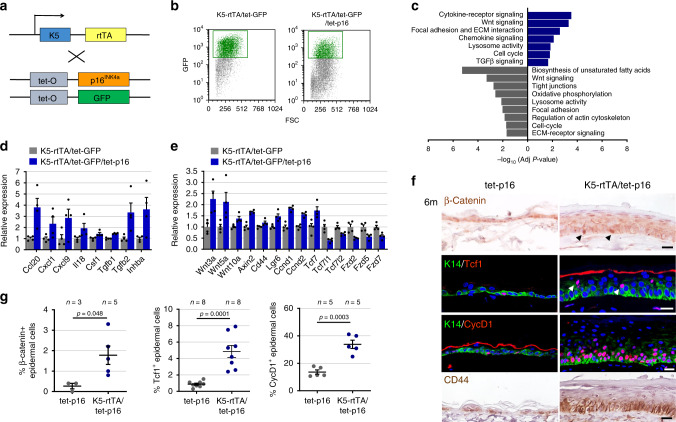
Fig. 4. p16 expression activates Wnt-pathway-associated genes.
a Diagram of transgenic mouse lines crossed for co-induction of GFP and p16. b FACS plots showing GFP levels and gates used for isolation of GFP+ epidermal cells from K5-rtTA/tet-GFP/tet-p16 (right) and control K5-rtTA/tet-GFP (left) mice, after 6 months of induction. Plots show the CD31−/CD140a−/CD45− cell fraction only. c Gene sets whose expression was preferentially upregulated (blue) or downregulated (grey) in GFP+ cells from p16-expressing mice relative to GFP+ cells from control mice. Values indicate –log10 (adjusted P value) by hypergeometric test. d mRNA levels of genes encoding cytokines and genes associated with the TGFβ pathway upregulated in p16-expressing GFP+ cells, measured by mRNA-seq. Values were normalized to the mean expression levels in GFP+ cells from control mice, defined as 1. P < 0.05 for all genes, n = 4 samples per group, each pooled from 3 mice. e Relative mRNA levels of genes associated with the Wnt pathway in the same samples. P < 0.05 for all genes, n = 4 samples per group, each pooled from 3 mice. f Skin sections from K5-rtTA/tet-p16 and control tet-p16 mice treated with dox for 6 months stained for β-Catenin, Tcf1, Cyclin D1 or CD44. Arrowheads indicate representative positively stained cells. g Percentages of nuclear β-catenin+, Tcf1+, and CyclinD1+ IFE cells in control and p16-expressing mice after 6 months of induction, as scored visually from images. P values calculated by t test. All graphs indicate mean across mice ± S.E.M. Scale bars—20 μm.

