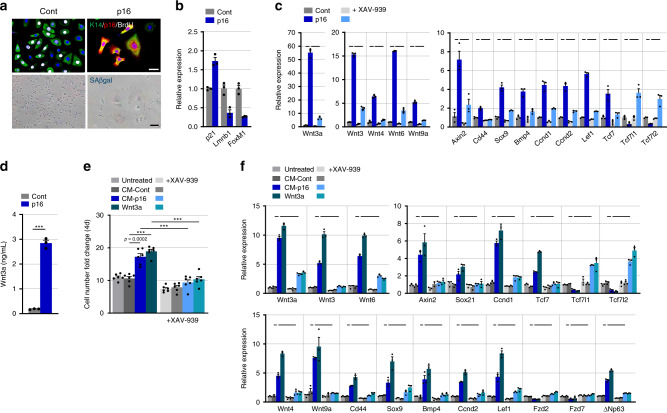
Fig. 5. p16-overexpressing primary keratinocytes stimulate proliferation of naive cells through Wnt secretion.
a Primary mouse keratinocytes infected with a p16-expressing or control lentivirus, co-stained for K14 (green), p16 (red) and BrdU (indicating S-phase, white), or for SA-βGal, 10 days after infection. b Relative mRNA levels of the indicated genes in the same keratinocytes, measured by qRT-PCR. n = 3 replicates. P < 0.05 for all genes. c Relative mRNA levels of the indicated Wnt-associated genes measured by qRT-PCR in control and p16-expressing keratinocytes. Values are also shown for the same cells treated with the β-catenin inhibitor XAV-939 (5 μM) for 24 h. n = 3 replicates. P < 0.05 for all comparisons indicated by lines: p16 versus control (dark blue versus dark grey, short lines), and p16 versus p16+XAV-939 (light blue versus dark blue, long lines). d Secreted Wnt3a protein levels in medium of control and p16-expressing cells, measured by ELISA. n = 3 replicates. ***P < 0.0001 e Fold increase over 4 days in numbers of primary keratinocytes cultured with conditioned media from p16-expressing (CM-p16) or from control (CM-Cont) keratinocytes, or with 10 ng/ml recombinant Wnt3a, in the absence or presence of XAV-939 (darker and lighter columns, respectively). n = 6 replicates. ***P < 0.0001. f Relative mRNA levels of the indicated Wnt-associated genes measured by qRT-PCR in keratinocytes treated for 24 h with conditioned media from p16-expressing or control cells, or with Wnt3a, in the presence or absence of XAV-939. n = 3 replicates. P < 0.05 for all comparisons indicated by lines: CM-p16 versus CM-Cont (dark blue versus dark grey, short lines), and CM-p16 versus CM-p16+XAV-939 (light blue versus dark blue, long lines). All graphs indicate mean across replicates ± S.E.M., t test. Scale bars—50 μm.

