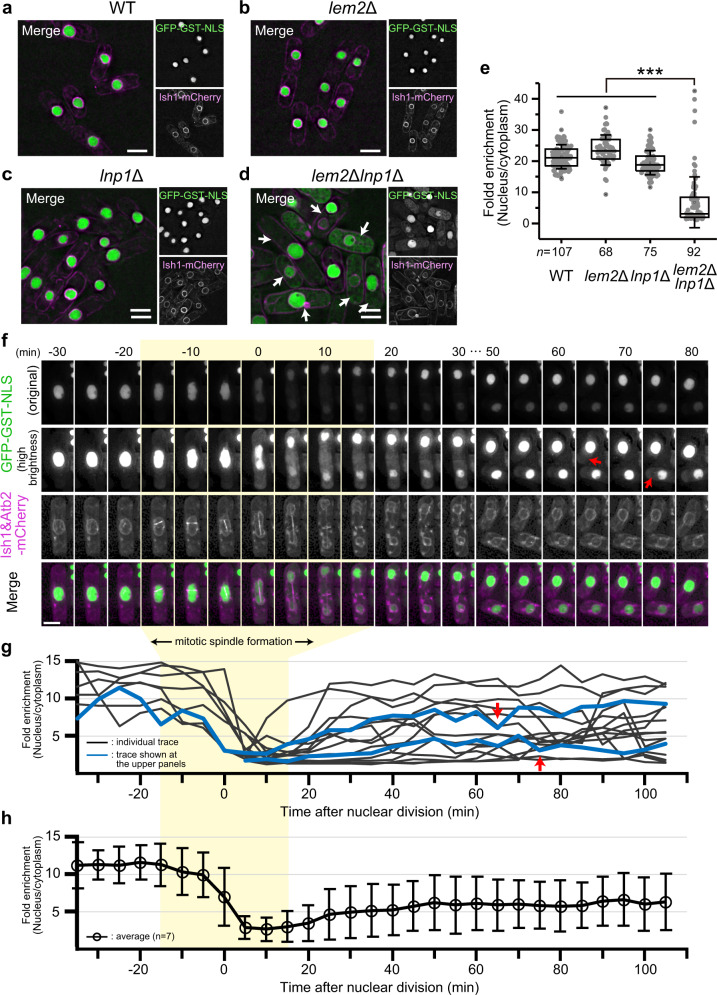
Fig. 2. Nuclear protein leakage occurs in lem2Δlnp1Δ cells.
a–d The lem2Δlnp1Δ cells showed a leaky phenotype of GFP-GST-NLS. GFP-GST-NLS (green) and Ish1-mCherry (magenta) were co-expressed in WT (a), lem2Δ (b), lnp1Δ (c), and lem2Δlnp1Δ (d) cells. Arrows indicate cells showing leakage of GFP-GST-NLS signal. Scale bar represents 5 μm. e Quantification of nuclear enrichment of GFP-GST-NLS signal. Fold enrichment of GFP-GST-NLS signal in the nucleus (nucleus/cytoplasm) was quantified (gray dots) by using unprocessed original images and plotted as a box-and-whisker plot. The horizontal lines in the box indicate the upper quartile, median, and lower quartile, from top to bottom, respectively; the whisker indicates standard deviation. n indicates the total cell number counted. p Values are from Steel–Dwass test. ***p < 0.001. f–h Leakage of nuclear proteins occurred independent of the cell cycle. f The lem2Δlnp1Δ cells expressing GFP-GST-NLS, Ish1-mCherry, and Atb2-mCherry were observed in living state during vegetative cell growth. Single-section images after denoising and deconvolution are shown as a time course. High-brightness images for GFP-GST-NLS are shown to present the leakage. Red arrows indicate the timing of leakage at the interphase. Scale bar represents 5 μm. g, h Fold enrichment of GFP-GST-NLS in the nucleus was quantified over time. The values from seven individual mitotic events were plotted (g). The blue lines represent the quantification results displayed in f. Mean ± standard deviation of the seven quantifications is plotted in h. Red arrows indicate the timing of leakage at the interphase.

