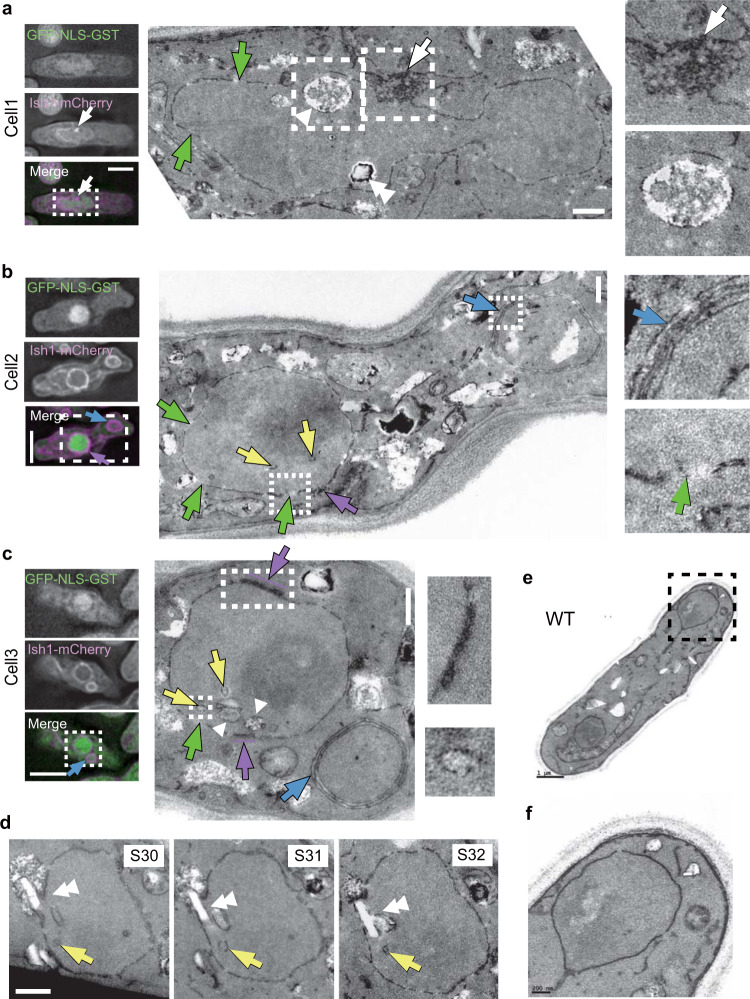
Fig. 3. Abnormal NE and ER membranes in lem2Δlnp1Δ cells.
The lem2Δlnp1Δ cells expressing GFP-GST-NLS and Ish1-mCherry were observed by CLEM. a–c Single-section images after denoising and deconvolution from three independent cells are shown. The dashed square regions in the fluorescence images (left) correspond to the electron micrographs (middle). The dashed square regions in the electron micrographs are enlarged on the right. Serial sections of the nucleus in c are shown in d. Colored arrows indicate highly aggregated Ish1-positive membrane (white), nuclear membrane rupture (green), invaginated membrane (yellow), multi-layer nuclear membrane (purple), and multi-layer membrane vesicle distinct from the nucleus (blue). Arrowheads indicate a vacuole-like structure, and double arrowheads indicate a crystal-like structure penetrating the nuclear membrane. Scale bars in fluorescence and electron microscopy images represent 5 μm and 500 nm, respectively. e, f Electron micrographs of a WT cell as a control. The dashed square region in e is enlarged in f. Scale bars in e and f represent 1 μm and 200 nm, respectively.

