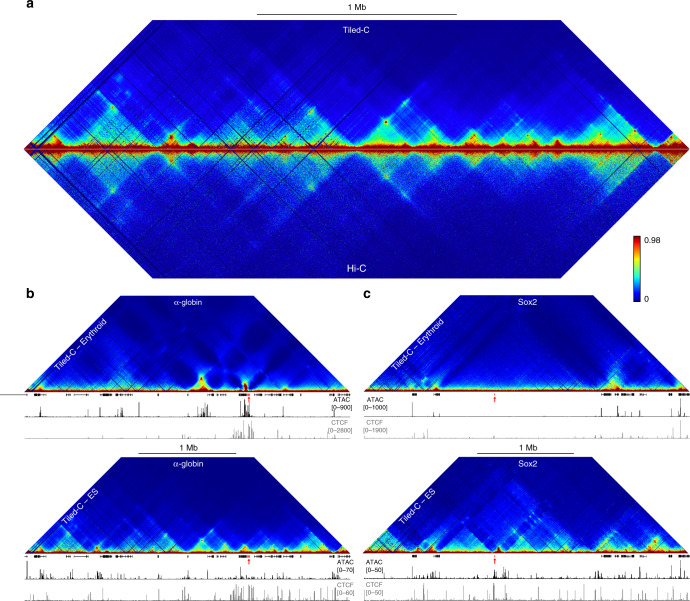
Fig. 1. Tiled-C generates deep all vs all 3C data at regions of interest.
a Comparison of Tiled-C and Hi-C contact matrices at 2 kb resolution in mouse ES cells. Contact frequencies represent normalized, unique interactions in three and four replicates for Tiled-C and Hi-C data, respectively. Coordinates (mm9): chr11:29,902,000–33,228,000. b Tiled-C contact matrices of ~3.3 Mb spanning the mouse α-globin locus in primary mature erythroid cells (top) and ES cells (bottom) at 2 kb resolution. Contact frequencies represent normalized, unique interactions in three replicates. Gene annotation (α-globin genes highlighted in red), open chromatin (ATAC), and CTCF occupancy are shown below the matrices. Coordinates (mm9): chr11:29,902,000–33,228,000. c Tiled-C contact matrices of ~3.4 Mb spanning the mouse Sox2 locus in primary mature erythroid cells (top) and ES cells (bottom) at 5 kb resolution. Contact frequencies represent normalized, unique interactions in four replicates. Gene annotation (Sox2 gene highlighted in red), open chromatin (ATAC), and CTCF occupancy are shown below the matrices. Coordinates (mm9): chr3:33,200,000–36,565,000.

