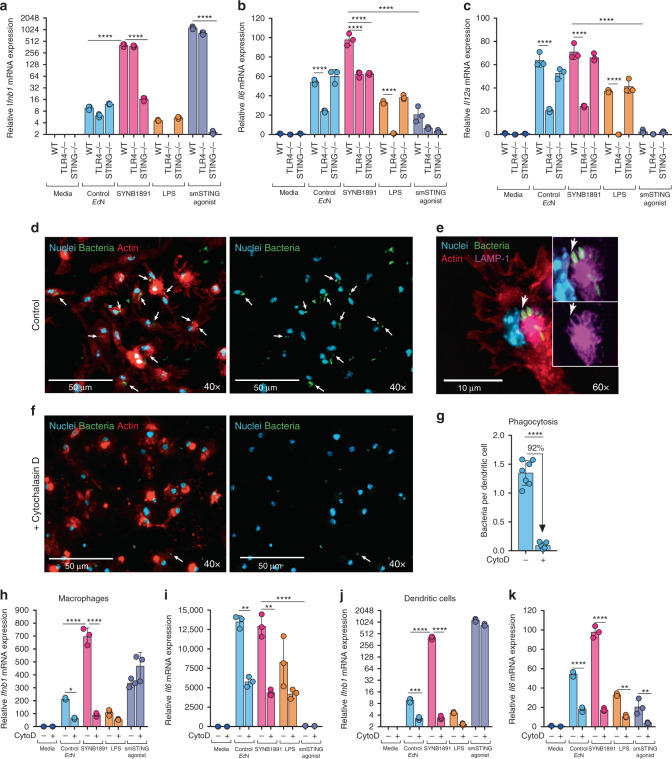
Fig. 3. Phagocytosis- and STING-dependent induction of type I interferon by SYNB1891.
a–c WT, TLR4−/− and STING−/− BMDCs were treated with Control EcN (MOI: 25), pre-induced SYN1891 (MOI: 25), LPS (100 ng/mL), or smSTING agonist (5 μg/mL) for 4 h (n = 3 biological replicates per group per genotype). BMDCs from each genotype incubated alone served as negative controls. Cells were analyzed for the upregulation of Ifnb1 (a), Il6 (b) and Il12a (c) mRNA (****P < 0.0001 two-way ANOVA with Tukey’s multiple comparisons tests, see Supplementary Fig. 3a for IFN-β1 protein quantification). d–g Representative fluorescent images and phagocytosis quantification. WT BMDCs were incubated with pre-induced SYNB1891-gfp (MOI: 25) for 1 h in control media (d, e) or pre-treated for 1 h with Cytochalasin D (10 μM) before bacterial incubation (f). Non-internalized bacteria were washed out and cells were stained for microscopy. Cell nuclei were labeled with Hoechst (Blue), F-actin was stained with ActinRed 555 probe (Red), SYNB1891-gfp were labeled with anti-GFP (Green), and phagosomal transmembrane protein LAMP-1 was labeled with anti-LAMP1 (Purple). White arrows point to bacteria co-localized within DC actin cytoskeleton (d–f). These bacteria are surrounded by phagosomal membrane stained with LAMP-1 (e). The number of bacteria per dendritic cell per field of view (FOV) was quantified in (g). 12 FOVs were evaluated in the experiment (7 for control and 5 for CytoD group) resulting in >200 cells per treatment quantified (**P < 0.0001, two-tailed unpaired Student’s t test). Images and data are representative of 2 independent experiments. h, i RAW 264.7 macrophages or (j, k) WT BMDCs were treated as described above in (a) (n = 3 biological replicates per group). In the indicated groups cells were pre-treated for 1 h with Cytochalasin D (10 μM). Macrophages or BMDCs incubated in media alone served as a negative control. Cells were analyzed for the upregulation of Ifnb1 (g, i) and Il6 (h, j) mRNA (*P = 0.0182, **P = 0.0017–0.006, ***P = 0.0005, ****P < 0.0001 two-way ANOVA with Tukey’s multiple comparisons tests, see Supplementary Fig. 3h–k for protein quantification,). a–c, g–k Data are representative of two or more independent experiments per cell type with mean and s.d. shown. Each circle represents an independent experimental replicate.

