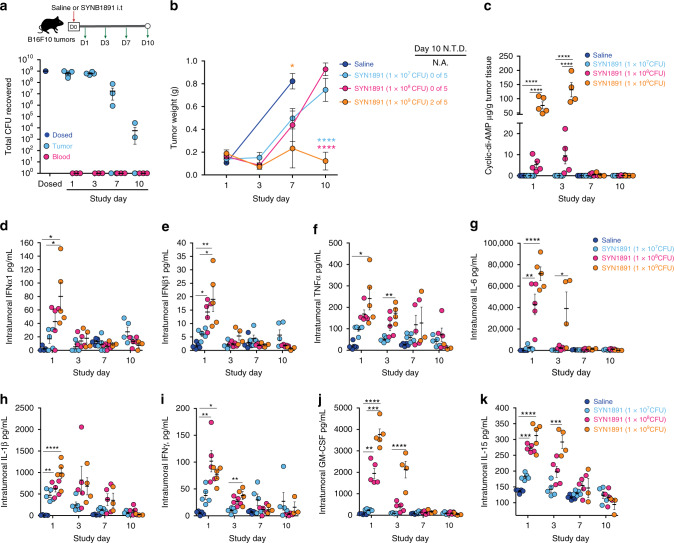
Fig. 4. In vivo dynamics of SYNB1891 in tumor bearing mice.
a–k B16.F10 tumor-bearing mice were treated with a single i.t. dose of either saline, 1 × 10⁷, 1 × 10⁸ or 1 × 10⁹ CFUs SYNB1891 on Study Day 0 (n = 5 injected mice per bacterial group per time point, for Saline group n = 5 injected mice for day 1 and day 7 analyzes, for the bacterial group 1 × 10⁹ CFUs SYNB1891 for day 3 n = 4 analyzed tumors, for days 7 and 10 n = 3 analyzed tumors due to no visible tumor mass upon dissection). a Bacterial abundance within tumor homogenates and blood at the indicated timepoints post-i.t. injection with 1 × 10⁹ CFUs (see Supplementary Fig. 4b, c for 1 × 10⁷ and 1 × 10⁸ doses). b Total tumor weight for treated mice at the indicated time points with mice having no visible tumor mass upon dissection (no tumor detected (N.T.D)) on Study day 10 (* P = 0.0163 (orange stars—indicated group vs 1 × 10⁹ CFUs SYNB1891), one-way ANOVA with Tukey’s multiple comparisons tests for Day 7; ****P < 0.0001 (blue stars—indicated group vs 1 × 10⁸ CFUs SYNB1891, pink stars—indicated group vs 1 × 10⁷ CFUs SYNB1891) two-way ANOVA for bacterial groups with Tukey’s multiple comparisons tests). Individual tumor volumes are presented in Supplementary Fig. 4a). c Cyclic-di-AMP abundance from tumor homogenates, and, (d–k), cytokine abundance from tumor supernatants for IFNα1 (d), IFNβ1 (e), TNFα (f), IL-6 (g), IL-1β (h), IFNγ (i), GM-CSF (j) and IL-15 (k) from treated mice at the indicated time points post-i.t injection (*P = [0.016–0.031], **P = [0.0011–0.0041], ***P = [0.0001–0.0003], ****P < 0.0001 one-way ANOVA with Tukey’s multiple comparisons tests at indicated time points). Data are representative of two independent experiments with mean and s.e.m. shown. Each circle in (a) and (c–k) represents an individual animal.

