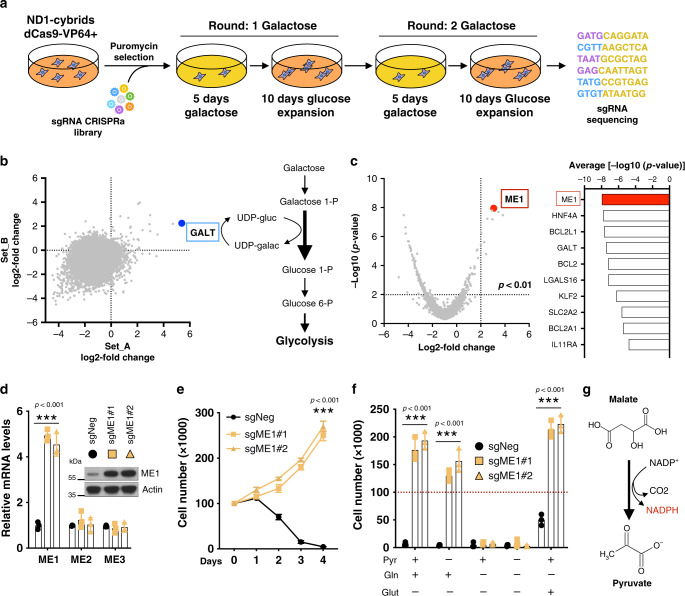
Fig. 1. Identification of ME1 through a gain-of-function CRISPR/Cas9 screen.
a Schematic overview of the genome-wide CRISPR activator screen. b Scatterplot showing gene enrichment after galactose challenge using two independent library replicate sets . Highlighted in blue is GALT gene, which represents the rate-limiting enzyme in galactose-to-glucose conversion. c Volcano plot highlighting ME1 (red dot) as the best scoring gene (left) and the top 10 scoring genes ranked by significance. d Specific mRNA and protein induction of ME1 using two different guides in ND1 mutant cells (n = 3). e Cell survival and proliferation curves in ME1-overexpressing ND1 mutant cells under galactose (n = 3). f Cell survival in ME1-overexpressing ND1 mutant cells cultured under galactose media for 96 h in the presence or absence of glutamine (4 mM), glutamate (4 mM), or pyruvate (1 mM) (n = 3). g ME1 catalyzes the decarboxylation of malate to pyruvate generating NADPH. Immunoblots shown are representative of >3 independent experiments, and all other experiments are represented as means ± SEM., n > 3 biological replicates. Asterisks denote *p < 0.05, **p < 0.01, or ***p < 0.001. Paired two-tailed Student’s t test in d, e and two-way ANOVA in f. Pyr pyruvate, Gln glutamine, Glut glutamate. Red dashed lines indicate initial seeding density.

