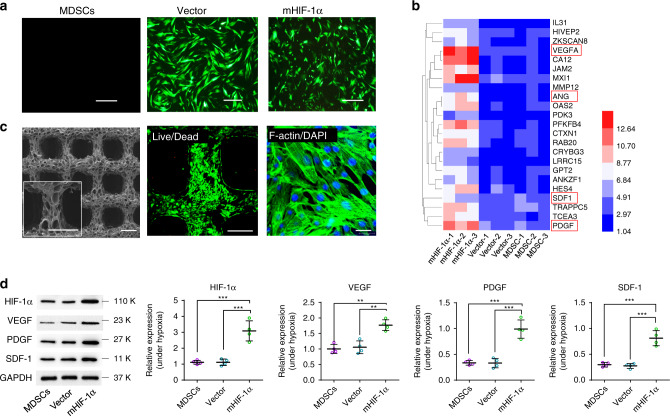
Fig. 2. Characterization of HIF-1α gene-mutated (mHIF-1α) MDSCs.
a Images showing three different groups of cells (MDSCs, vector and mHIF-1α groups) under fluorescence microscopy (scale bar, 100 μm) (n = 3). b High-throughput DNA sequencing reveals the difference in expression of most affected genes in cells of three different groups (MDSCs, vector and mHIF-1α groups) and is shown as a heat map (red represents highest expression level, blue represents lowest expression level) (n = 3). The genes in the red frames are the angiogenesis markers being studied in further experiments. c SEM image of 3D-printed scaffolds (left, scale bar 500 μm) as well as live/dead fluorescence image (middle, scale bar 300 μm) and DAPI/F-actin staining image (right, scale bar 30 μm) of HIF-1α gene-mutated MDSCs implanted on heparin-coated 3D-printed hydrogel scaffolds (n = 3). d Relative protein expression levels of HIF-1α, VEGF, SDF-1 and PDGF via WB detection in three different groups under hypoxia (n = 4). (Sidak's multiple comparisons test, two-way ANOVA. In HIF-1α, mHIF-1α vs MDSCs ***p = 0.0006, mHIF-1α vs Vector ***p = 0.0007; in VEGF, mHIF-1α vs MDSCs **p = 0.0049, mHIF-1α vs Vector **p = 0.0071; in PDGF, mHIF-1α vs MDSCs ***p = 0.0002, mHIF-1α vs Vector ***p = 0.0002; in SDF-1, mHIF-1α vs MDSCs ***p = 0.0007, mHIF-1α vs Vector ***p = 0.0005.) Data are displayed as mean ± SD and analysed by GraphPad Prism software.

