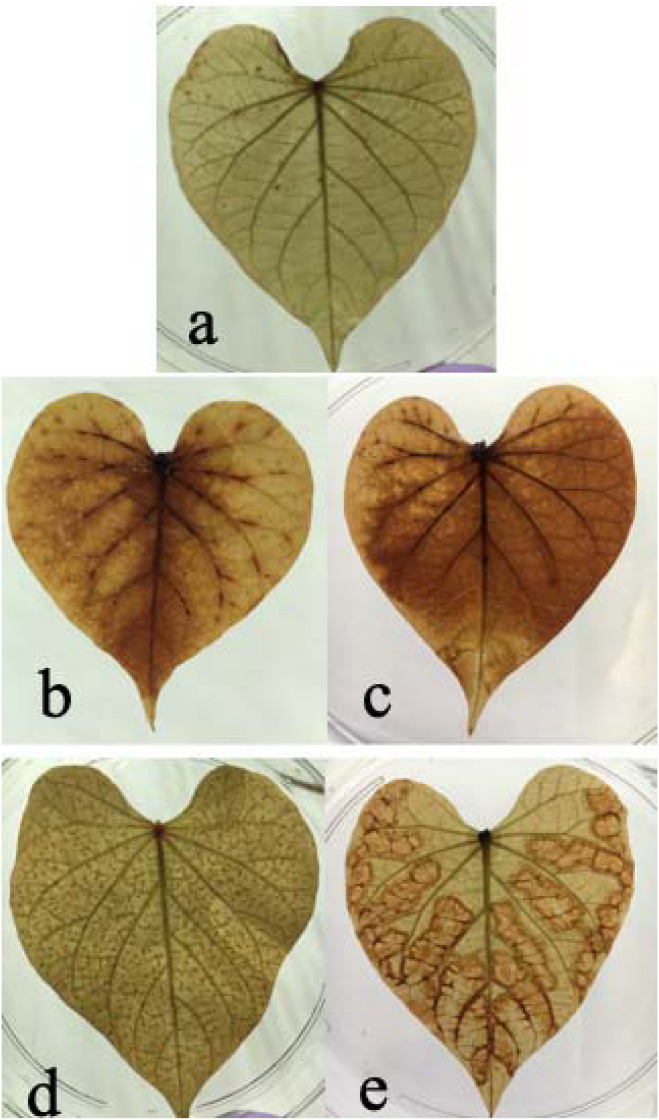
FIGURE 2.
Effects of cold and heat stress on H2O2 synthesis in leaves after 48 h of cold and heat treatment. (a) Control group. (b) 4°C cold treatment for 24 h. (c) 4°C cold treatment for 48 h. (d) 47°C heat treatment for 24 h. (e) 47°C heat treatment for 48 h. The results are based on DAB staining as described in the “Materials and Methods” section.

