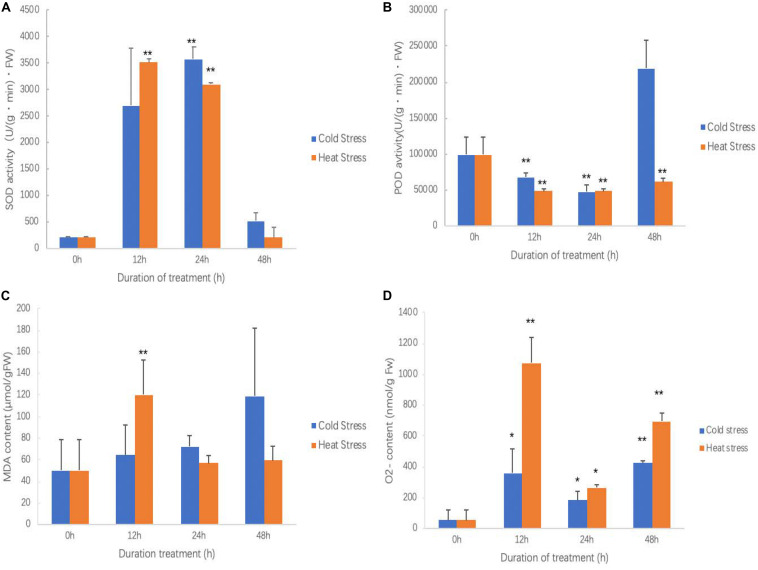
FIGURE 3.
Effects of cold and heat stress on physiological indexes in sweetpotato leaves after cold and heat treatment. (A) SOD activities. (B) POD activities. (C) MDA contents. (D) O2– contents. Five biological replicates were run for each treatment and control. Each treatment and control had five biological replicates for each measured trait at each time points. ANOVA was performed to analyze the significance between different treatment and controls at each time point. * presents significant difference between the treatment and the control with p < 0.05. ** presents extremely significant difference between the treatment and the control with p < 0.01.

