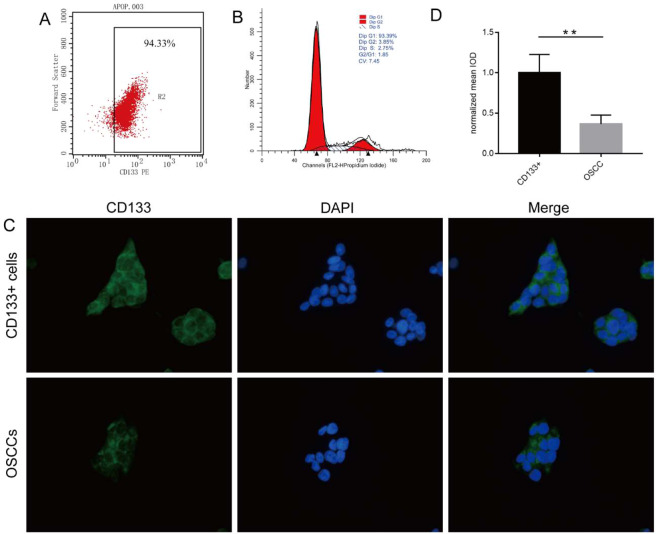
Figure 2.
Characterization of CD133+ OSCC cells. (A) CD133+ cells purified up to 94.33% using MACS. Expression of CD133 in 0.41%±0.06 of primary OSCC cells and detected by flow cytometry. (B) Cell cycle analysis of CD133+ cells revealing that 93.39% of CD133+ OSCCs cells were in the G0/G1 phase. (C) Immunofluorescence detection of CD133 expression on OSCC cells and primary OSCC cells. All images were obtained at 400× magnification. (D) The normalized mean IOD of CD133+ OSCC cells was higher than that of primary OSCC cells. Data were analysed by 2-tailed t test. **P < 0.01.

