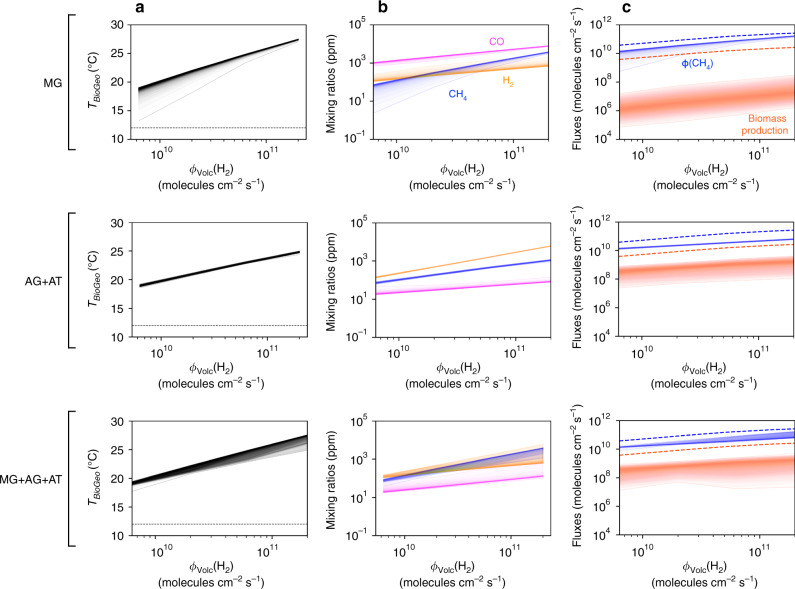
Fig. 2. Short-term biological feedback to the atmosphere and climate.
Effects are computed as a function of the H2 volcanic outgassing, for each ecosystem composition. MG indicates H2-based methanogens (MG). AG+AT indicates CO-based acetogens and methanogenic acetotrophs consortia. MG+AG+AT indicates co-occurring methanogens, acetogens, and acetotrophs. a Global surface temperature at ecosystem-climate equilibrium. The dotted line indicates the initial abiotic surface temperature, TGeo = 12 °C. b Atmospheric composition at ecosystem-climate equilibrium. c Biogenic fluxes at ecosystem-climate equilibrium: CH4 production and carbon fixation in biomass (in molecules of C cm−2 s−1). Envelopes represent probability distributions from Monte-Carlo simulations across the biological parameter space, with each layer indicating output frequency ranging from 90 to 51%. Predictions from ref. 13 are also shown (dashed) for comparison. See “Methods” and Supplementary Tables 3 and 4 for parameter values.

