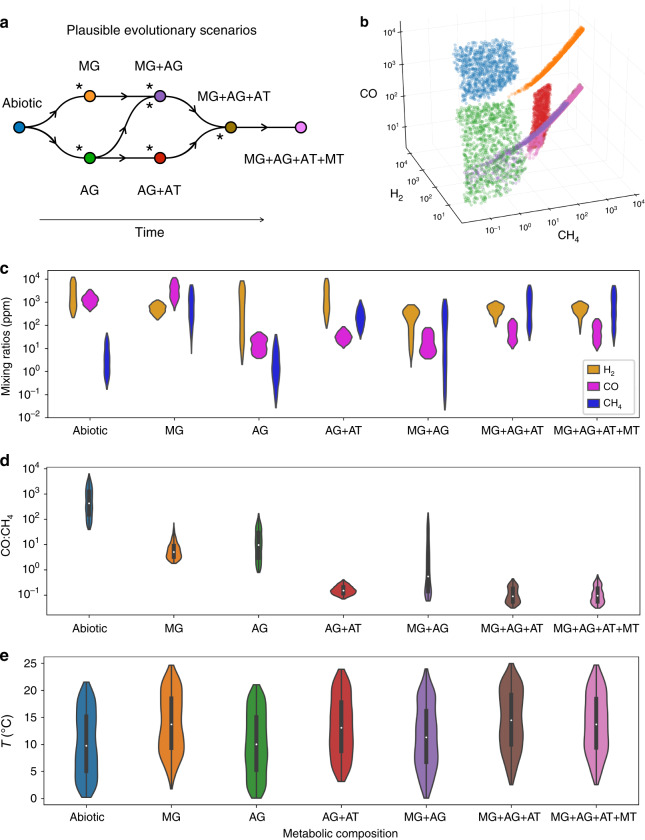
Fig. 4. Equilibrium state of the planet as the biosphere diversifies.
a Plausible evolutionary sequences of metabolic innovation. Asterisks denote transitions that are very likely to cause a significant change in the atmospheric composition. b Scatterplot of the atmospheric compositions at equilibrium in CO, CH4, and H2, color-coded by the corresponding biosphere composition (1000 simulations for each ecosystem). c Corresponding distributions. d Distribution of the CO:CH4 ratio for each scenario. e Distribution of the surface temperature in each scenario. The white dots in d, e represent the median of the distributions, the thick gray lines the interquartile range, and thin gray lines the rest of the distribution.

