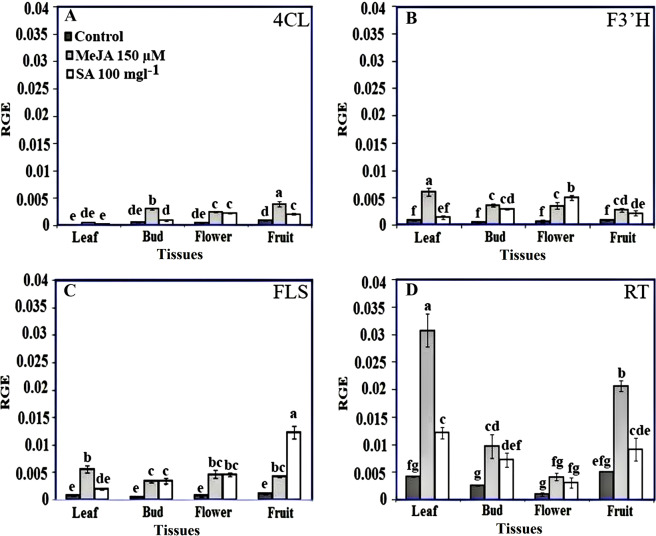
Figure 9.
Relative gene expression (RGE) of early, middle and last pathway genes of rutin biosynthesis including 4CL, F3′H, FLS and RT in different tissues of control (untreated) and MeJA- and SA-treated Caper plants. Real-time qPCR was based on the Ct values. The Ct value for each sample was normalized using the reference gene Ubiquitin. Bars with different letters are significantly (P < 0.05) different according to Duncan’s test. Error bars indicate standard error values.

