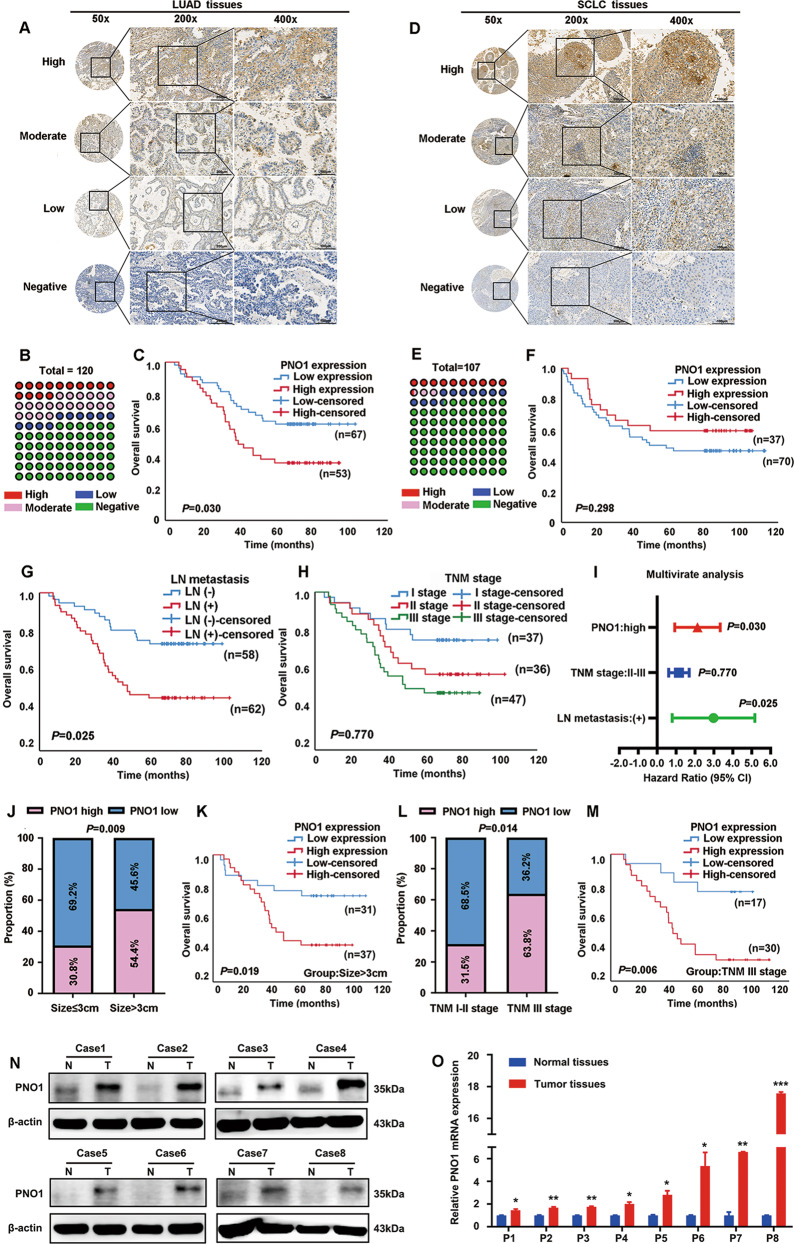
Fig. 1. PNO1 is a specific prognostic biomarker in LUAD.
a IHC analysis of PNO1 expression in tissue microarrays of LUAD specimens (scale bar, 200 μm or 100 μm). b The proportions of LUAD patients with different PNO1 expression levels. c Kaplan–Meier survival curve showing the correlation between the PNO1 IHC score and OS of LUAD patients. d IHC analysis of PNO1 expression in tissue microarrays of SCLC specimens (scale bar, 200 μm or 100 μm). e The proportions of SCLC patients with different PNO1 expression levels. f Kaplan–Meier survival curve analysis showing the correlation between the PNO1 IHC score and OS in SCLC patients. g, h Kaplan–Meier survival curve analysis showing the correlations between LN metastasis or TNM stage and OS in LUAD patients. i Forest plots showing the multivariate risk factors of LUAD patients. j Correlation analysis between the PNO1 IHC score and tumor size. k Kaplan-Meier survival curve showing the correlation between the PNO1 IHC score and OS in a subgroup of LUAD patients (tumor size >3 cm). l Correlation analysis between the PNO1 IHC score and TNM stage. m Kaplan–Meier survival curve showing the correlation between the PNO1 IHC score and OS in a subgroup of LUAD patients (TNM stage III). n, o Western Blotting and RT-PCR showing the differences in the PNO1 protein and mRNA levels between eight pairs of LUAD tissue and adjacent nonmalignant tissue. nsP > 0.05, *P < 0.05, **P < 0.01, ***P < 0.001.

