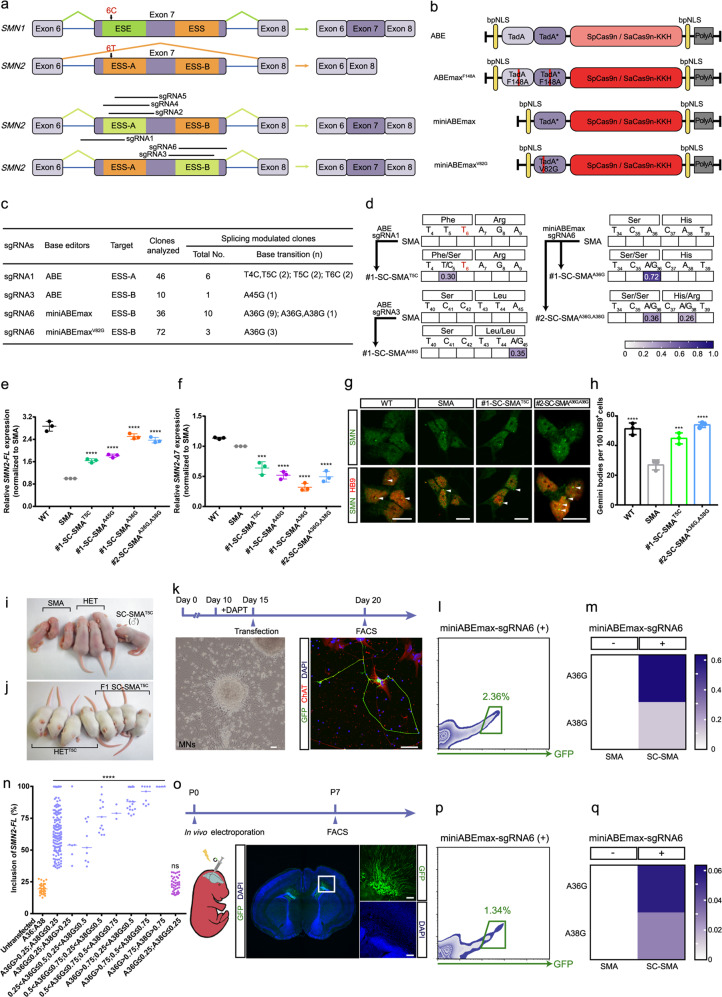
Fig. 1. Base editing-mediated conversion of exonic splicing silencers rescues SMA.
a Schematic of the base editing-mediated conversion of ESS-A and ESS-B in exon 7 of SMN2. Black arrows indicate the difference of a single nucleotide (C6T) between SMN1 and SMN2. Horizontal bars represent sgRNAs. b Maps of the plasmids used in this study. c Base editing efficiencies targeting ESS-A and ESS-B. d Heat map showing the editing efficiencies for an ABE-sgRNA1-edited SMA iPSC, an ABE-sgRNA3-edited SMA iPSC, and two miniABEmax-sgRNA6-edited SMA iPSCs. e, f TaqMan qPCR analysis of full-length SMN2 (SMN2-FL) mRNA (e) and truncated SMN2-Δ7 mRNA (f). Gene expression was normalized to the SMA iPSCs, which was arbitrarily set to 1 (n = 3). Data represent means ± SD. g Nuclear gemini body (white arrows) localization in the MNs derived from iPSCs of four genotypes: SC-SMAA36G,38G, SC-SMAT5C, SMA, and WT, co-stained with SMN (green) and HB9 (red) antibodies. Scale bar, 10 μm. h Quantification of SMN+ gemini bodies in 100 HB9+ motor neurons (n = 3). Data represent means ± SD. i The SC-SMAT5C founder mice were similar in size to the heterozygous littermates (Smn+/−, SMN22TG/0) (termed HET) at postnatal day 9. j SC-SMAT5C progeny mice exhibited no clear phenotypic differences compared to the HETT5C mice. k Timeline for base editing in SMA iPSC-derived postmitotic MNs. Left to right: The morphology of postmitotic MNs at day 15, and the treated postmitotic MNs (at day 20) were co-stained against ChAT (red), GFP (green), and DAPI (blue). Scale bar, 50 μm. l FACS of successfully transfected SMA iPSC-derived postmitotic MNs. m Heat map showing the editing efficiencies for miniABEmax-sgRNA6-edited SMA iPSC-derived postmitotic MNs. n High-throughput sequencing analysis of SMN2-FL transcript expression levels of SMA iPSC-derived single untransfected (far left) and miniABEmax-sgRNA6 transfected postmitotic MNs. Scatter dot plot; the center line indicates the median. o Timeline for base editing in vivo in SMNΔ7 SMA mouse. Immunohistochemistry of transfected neurons with staining against GFP (green) and co-staining with DAPI (blue). Insets in the images are enlarged (original magnification, ×5.0) to the right. Scale bar, 100 μm. p FACS of successfully transfected SMNΔ7 SMA mouse neurons. q Heat map showing the editing efficiencies of miniABEmax-sgRNA6 in neurons derived from SMNΔ7 SMA mouse. ns, not significant; ***P < 0.001; ****P < 0.0001; one-way ANOVA.

