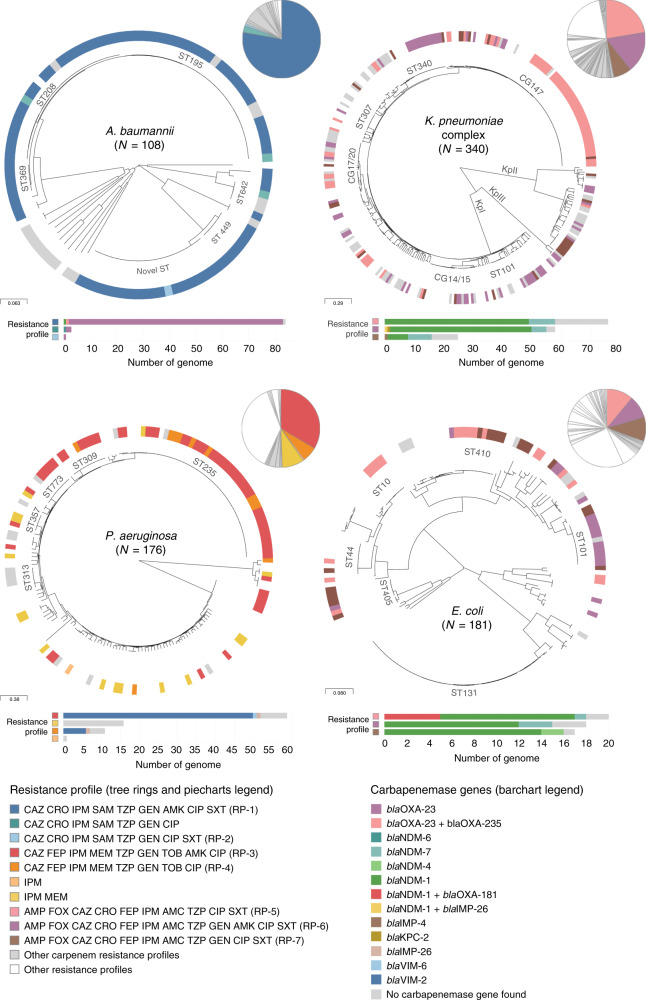
Fig. 3. Carbapenem resistance profiles are not associated with specific genetic lineages.
Phylogenetic trees showing the major lineages of A. baumannii, P. aeruginosa, K. pneumoniae species complex and E. coli, indicating the position of select sequence types (ST) and clonal groups (CG). KpI K. pneumoniae sensu stricto, KpII K. quasipneumoniae, KpIII K. variicola. Tree ring: select carbapenem resistance profiles from Fig. 2 are shown in colour. The remaining carbapenem resistance profiles are shown in light grey. Other resistance profiles (susceptible to carbapenems) are shown in white for simplicity. The three-letter antibiotic codes are as in Table 1. The pie charts show the relative abundance of the resistance profiles in the retrospective collection of sequenced genomes. The bar charts show the distribution of carbapenemase genes across the key resistance profiles. The scale bars show the number of SNPs per variable site. The data are available at https://microreact.org/project/ARSP_ABA_2013-14 (Aba), https://microreact.org/project/ARSP_PAE_2013-14 (Pae), https://microreact.org/project/ARSP_KPN_2013-14 (Kpn) and https://microreact.org/project/ARSP_ECO_2013-14 (Eco).

