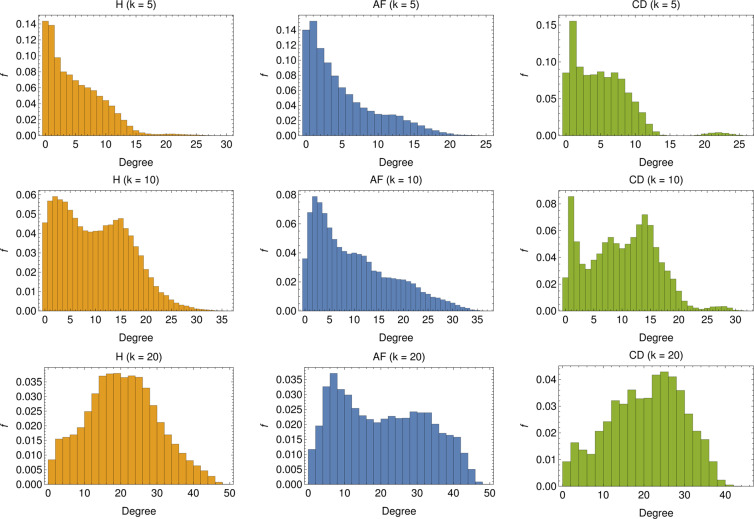
Figure 13.
In-degree distribution for several choices of : The distributions are realized by merging the degree distributions of 1000 different realizations of -node graphs. For low values of (i.e. ) we see that, for both the H and AF cases, the majority of nodes display rather low in-degree, and the in-degree distribution exhibits a long tail. Conversely, for the CD case, the in-degree is rather homogeneous up to , beyond which the tendency of nodes to acquire more links is softened (apart for a tiny fraction of nodes with ). By increasing , nodes with low degree get fewer but still the most predominant for both H and AF patients but new peaks appear in the distribution (see ) highlighting a change of the topological structure of the network (see also the CD case). This structural change is clear for higher values of (i.e. ), especially for H and CD, for which low-linked nodes are fewer, the majority of nodes presenting an in-degree comparable with (), ultimately suggesting that the networks are becoming regular.

