Figure 3.
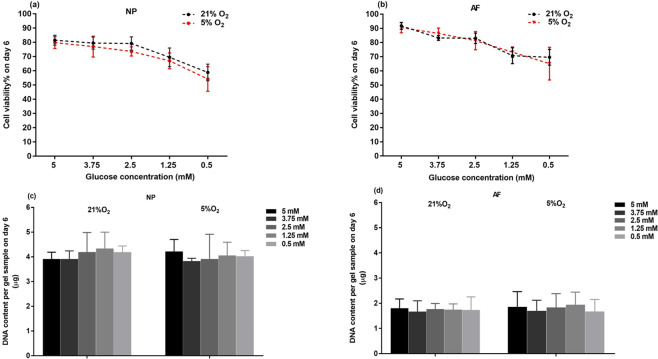
Viability and DNA content of (a,c) NP and (b,d) AF cells at various glucose concentrations under 21% and 5% O2 on day 6 (n = 9). For viability of NP cells under both 21% and 5% O2, 5 mM, 3.75 mM, 2.5 mM glucose > 1.25 mM > 0.5 mM (p < 0.05). For viability of AF cells under both 21% and 5% O2, 5 mM, 3.75 mM, 2.5 mM glucose > 1.25 mM, 0.5 mM glucose (p < 0.05). No statistical significances were found in DNA content among the different treatment groups for both NP and AF cells.

