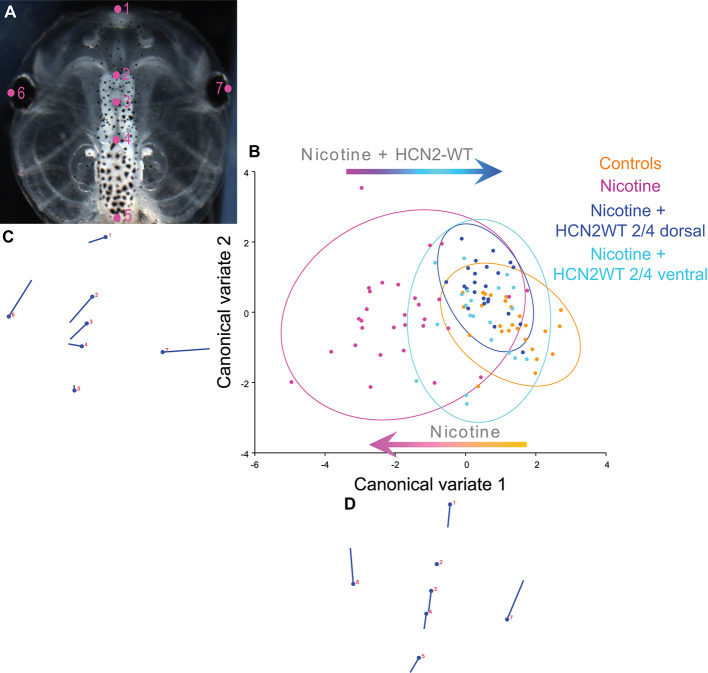
Figure 2.
Both local (CNS) and distant (non-CNS) expression of HCN2 channels restore brain size in proportion to head shape in nicotine-exposed embryos. (A–D) Morphometrics canonical variate analysis of brain size in proportion to head shape of stage 45 tadpoles. Representative image of a stage 45 control tadpole (A) illustrating the seven landmarks used in this analysis. (B) Canonical variate analysis, showing confidence ellipses for means at a 0.95 probability of shape data. Confidence ellipses are colored to correspond with treatment as indicated. N > 20 for each group. Procrustes distances: Control vs. nicotine = 0.1, Control vs. nicotine+dorsal-HCN2-WT = 0.04, Control vs. nicotine+ventral-HCN2-WT = 0.05. ANOVA of centroid shape between the controls, nicotine treatment, and nicotine+HCN2-WT (both dorsal and ventral) showed significant differences between the groupings (dorsal microinjection—F = 10.67, p < 0.0001; ventral microinjection—F = 9.0, p < 0.0001). (C,D) Canonical variate axis legend showing the movement of each of the seven landmarks. Each ball represents the landmark as indicated by the number and the accompanying stick represents the direction and extent of movement of that particular landmark.

