FIGURE 2.
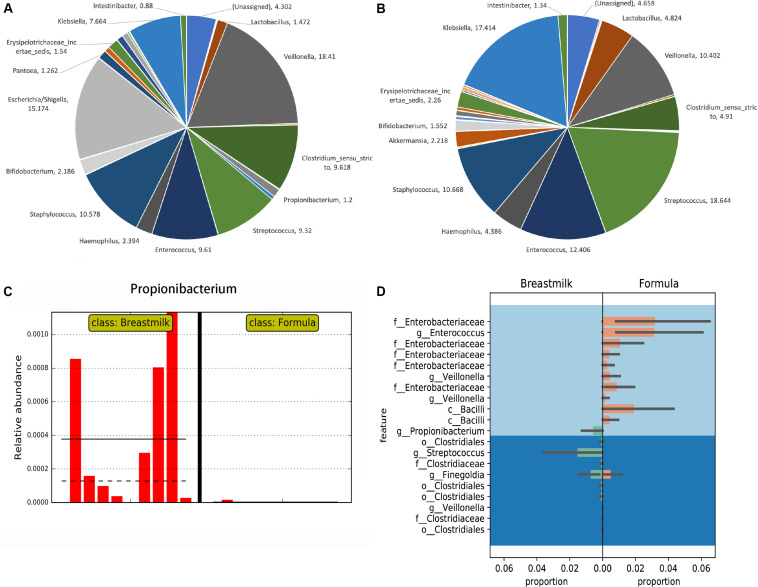
Taxonomy comparisons between MBM- and formula-fed infants based on the 16S rRNA gene amplicon sequencing results. (A) Taxonomy pie charts of the proportion in the MBM group in genus level from UPARSE. The number of each sector is the percentage of that bacteria. (B) Taxonomy pie charts of the proportion in the formula-fed group in genus level from UPARSE. The number by each section refers to the percentage of that bacteria. (C) The LEfSe result on the relative abundance found in Propionibacterium between MBM- and formula-fed infants. (D) Differential relative abundances of taxa between MBM- and formula-fed infants based on Gneiss.

