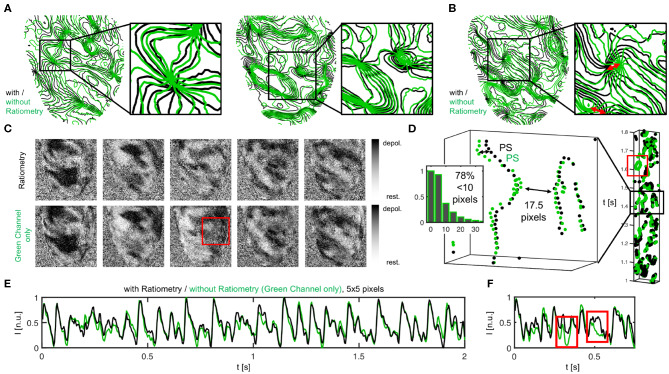
Figure 12.
Vortex wave and phase singularity dynamics measured during VF on the contracting heart surface with numerical motion tracking and -stabilization alone (green) compared to with numerical motion tracking and -stabilization and ratiometry (black), respectively. (A) Good agreement between phase maps obtained with or without ratiometry, both equally showing vortex waves and vortex cores in the same locations. Phase maps are displayed as isocontour lines indicating lines of equal phase. Vortex cores or phase singular points are displayed as nodal points. (B) Slight mismatches and subtle differences between vortex waves and vortex core positions with and without ratiometry. (C) Optical maps with and without ratiometry are visually nearly indistinguishable (except for few occasions, see red box). (D) Space-time plot showing motion of phase singularities across heart surface over time (y-axis), once from green channel alone and with ratiometry (black). Distribution of green-black phase singularity distances (> 17, 000 phase singularities in 1, 800 video frames over duration of 7.2 s). (E,F) Optical traces obtained during VF with (black) and without (green) ratiometry.

