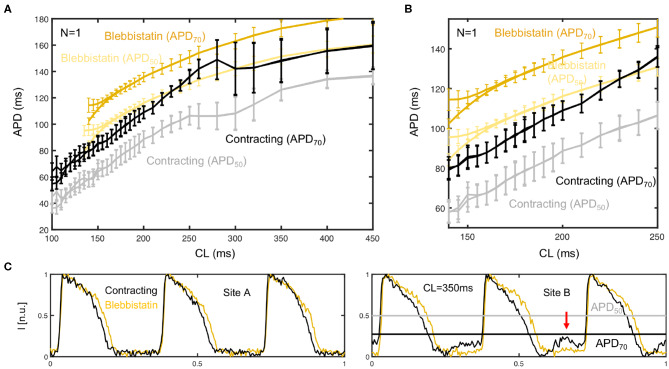
Figure A1.
Cardiac restitution curves determined from APD50 and APD70 measurements. At 30% of the height of the action potential (APD70) the APD is longer than at 50% (APD50), but also includes larger measurement errors for lower pacing frequencies. (A) In this mid-frequency regime with large motion, the APDs are overestimated at APD70 and underestimated at APD50. (B) At higher frequencies or shorter cycle lengths CL <200ms both APD70 and APD50 values appear to provide reliable measurement data. (C) Corresponding time-series obtained at upper limit of mid-frequency range (CL = 350ms), which hint at measurement artifacts. In one site (site A) the optical traces look unobjectionable, whereas in another (site B) they exhibit motion artifacts that could be related to the under- or overestimation of APD shown in (A).

