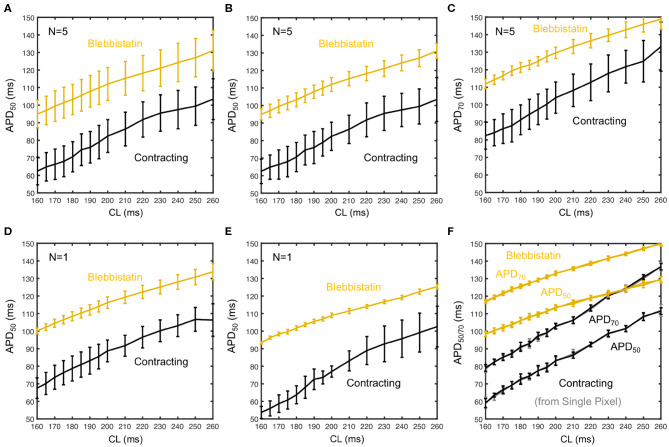
Figure 6.
Measurement uncertainty during optical cardiac restitution measurements on left ventricular surface of contracting (black) and contraction-inhibited hearts (Blebbistatin, yellow) for CL = 160 − 260 ms. (A) Average restitution curves including variability across hearts (means and standard deviations calculated from pooled APD50 of N = 5 hearts). (B) Standard deviation calculated individually for each heart, mean from pooled APD50 as in (A). Error bars indicate higher APD variability and potentially APD dispersion on the contracting heart surface. (C) Average APD70 restitution curve (N = 5 hearts, derived as in B). (D,E) APD50 restitution curves from two individual hearts, respectively. (F) Restitution curve measured in a single pixel (central region of field of view) from 30 consecutive action potentials (error bars: standard deviation of the 30 APDs).

