Figure 7.

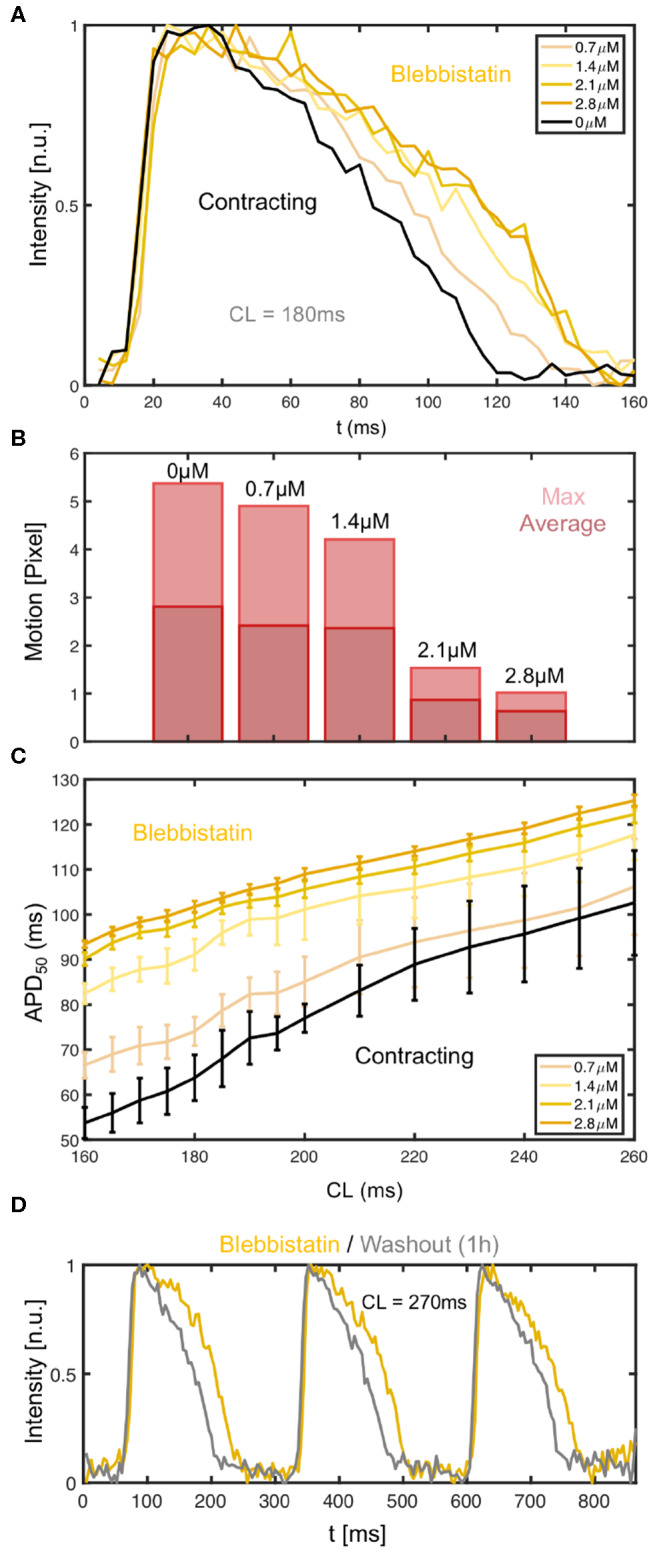
Dependence of action potential duration (APD) and restitution curve on Blebbistatin concentration. (A) APD prolongation with increasing Blebbistatin concentrations (black: 0μM contracting, light to dark yellow: 0.7 − 2.8μM Blebbistatin) at a cycle length of CL = 180ms. Optical traces obtained from 3 × 3 pixels (spatial averaging), single action potentials without temporal averaging. (B) Contractile motion at different Blebbistatin concentrations: baseline 0μM at CL = 180ms, decreasing contractility with 0.7 − 2.8μM. (C) Blebbistatin concentration-dependence of restitution curves: increasing Blebbistatin concentrations prolong the APD over all cycle lengths (N = 1 heart, APD50, black: 0μM contracting, light to dark yellow: 0.7 − 2.8μM Blebbistatin). The error bars become smaller with increasing Blebbistatin concentrations and decreasing contraction magnitudes. (D) Shortening of action potential after washout (1h) of Blebbistatin (gray) at cycle length of CL = 270ms on left ventricular surface.
