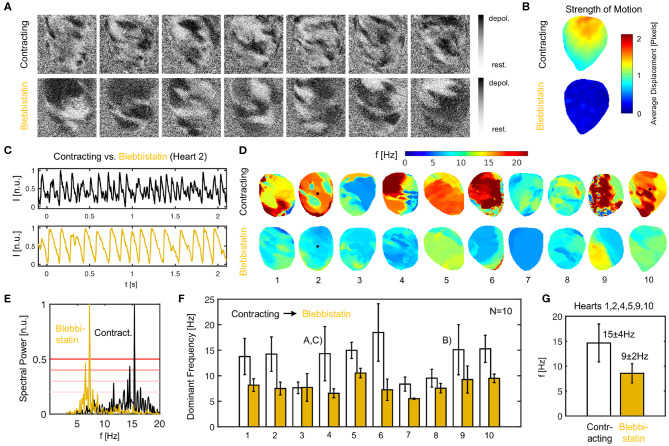
Figure 9.
Ventricular fibrillation (VF) is faster in contracting than in Blebbistatin-arrested isolated rabbit hearts. (A) Raw optical mapping data (pixel-wise normalized) showing action potential waves during VF on contracting (top) and contraction-inhibited (bottom) ventricular surface, see also Supplementary Video 2. (B) Contractile motion without (top) and with (bottom) Blebbistatin during VF measured with numerical motion tracking (time-averaged). (C) Exemplary time-series (averaged from 5 × 5 pixels, inverted) showing action potential sequence on contracting heart surface (black) and with Blebbistatin (yellow). (D) Dominant frequency maps. (E) Exemplary power spectrum (cumulative from all pixels, heart 2) with and without Blebbistatin. (F) Frequencies in N = 10 hearts during 8 sec. long VF episodes without (white) and with Blebbistatin (yellow). Mean values and standard deviations computed from data in (D,E) including at least 5, 000 pixels containing time-series as shown in (C). 4th and 9th bar plot pairs correspond to data shown in (A–C), respectively. (G) Typical dominant frequencies during VF with and without Blebbistatin (averaged from N = 6 hearts).

