
FIGURE 1.
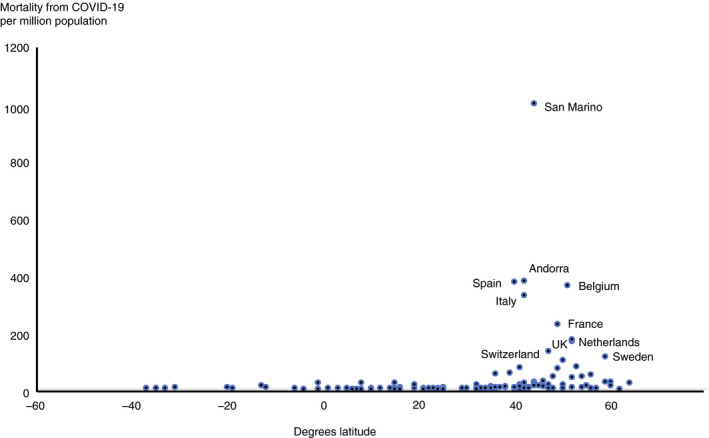
Correlation between mortality from COVID‐19 per million by country and latitude. All countries with >150 cases included. Data are from https://www.worldometers.info/coronavirus/ 3 accessed 15th April 2020. Latitude is for capital city. It can be seen that mortality is relatively low at latitudes less than 35 degrees North, the point below which adequate sunlight is likely to have been received to maintain vitamin D levels during the winter. Correlation between mortality and latitude r = 0.53, P < 0.0001 by Spearman's rank correlation