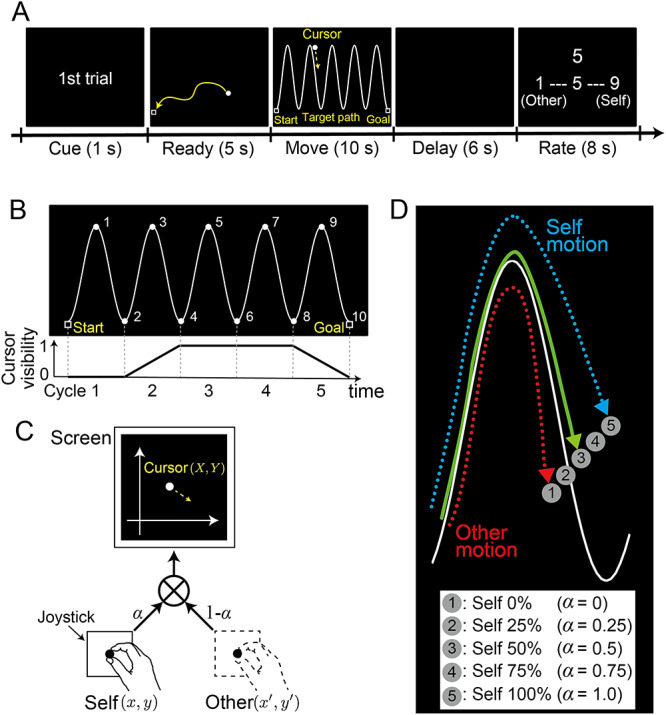
Figure 2.

(A) Trial timeline. After moving a cursor to the start position (shown as a square) during the 5-s ready period, participants traced a sinusoidal target-path with a cursor controlled by a joystick during the 10-s move period. Following a 6-s delay period, participants assigned a score (on a 9-point Likert scale) to their self-other attribution by pushing buttons. (B) Target path (top). Numbers were sequentially presented every second to help participants maintain the required pace of tracing. Cursor visibility (bottom). The cursor was invisible on the screen during the first 2.0 s (first cycle). Visibility linearly increased from zero to one over the next 2.0 s (second cycle). Here, zero corresponds to black (RGB: 0, 0, 0), which is the same brightness as the background, while one corresponds to white (RGB: 255, 255, 255). The cursor continued to be clearly visible during the next 4.0 s (third and fourth cycles) and then linearly became darker from 8.0 to 10 s (fifth cycle). (C) Morphing method. Cursor position on the screen (X, Y) was the weighted summation of the joystick position controlled by the current participant (self) (x, y) and a pre-recorded joystick position (other) (x’, y’). Weights were modified by a morphing ratio ( ). (D) Cursor trajectories. Circles labeled with numbers (1–5) illustrate how the cursor position was changed according to the five morphing ratios (
 ): self 0% (number 1) to self 100% (number 5) at every 25% step. In the self-other mixed conditions (number 2, 3, or 4), the cursor was displayed between the position of the participant’s own joystick and the position of the other person’s joystick.
