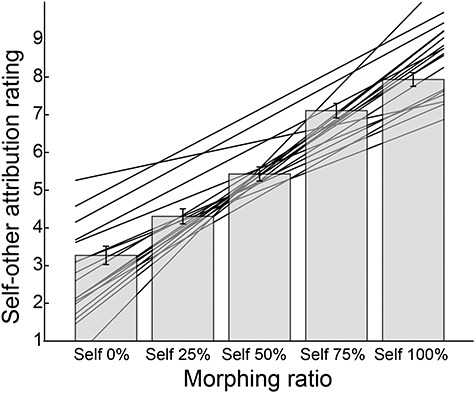
Figure 3.

Self-other attribution rating scores averaged across participants for each morphing ratio. The higher the score was, the more strongly participants felt that the cursor movement was attributed to their own joystick movement. Error bars indicate standard error of the mean. A linear regression model was fitted to each participant’s rating scores. The regression lines of all participants are shown behind the bars.
