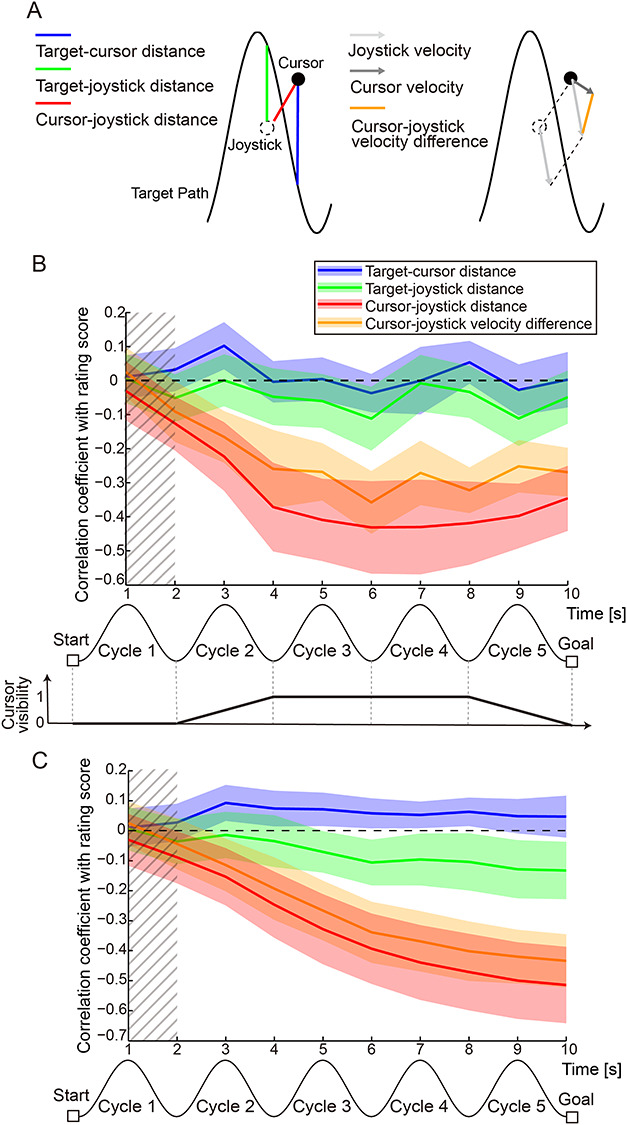
Figure 4.

Relationship between tracing behavior and rating score of self-other attribution of movement. (A) Schematic of the four behavioral measures whose relationships with the self-other attribution score were investigated. Blue, green and red lines in the left panel indicate the target-cursor, target-joystick, and cursor-joystick distances, respectively. Light and dark gray arrows in the right panel denote the joystick and cursor velocity, respectively. Orange line represents the cursor-joystick velocity difference. (B) Time courses of Fisher-transformed Pearson’s correlation coefficients between each behavioral measure and the self-other rating scores during the 10-s move period. Values of behavioral measures were averaged within every second. Colored shaded areas denote 95% confidence intervals. Bottom panel denotes visibility of the cursor during the move period. Hatched area denotes the period during which the cursor was invisible (i.e., cursor visibility was zero). Here, the data for self 50% condition are shown. Negative correlation indicates that the greater the behavioral measure became, the lower the score the participants gave (i.e., more other attribution). (C) Time courses of Fisher-transformed Pearson’s correlation coefficients between accumulated value of each behavioral measure and rating scores. Values of behavioral measures were averaged from movement onset to every second. Colored shaded areas denote 95% confidence intervals. Hatched area denotes the period during which the cursor was invisible. Note that the data for self 50% condition are shown. Negative correlation indicates that the greater the behavioral measure was accumulated, the lower the score the participants gave.
